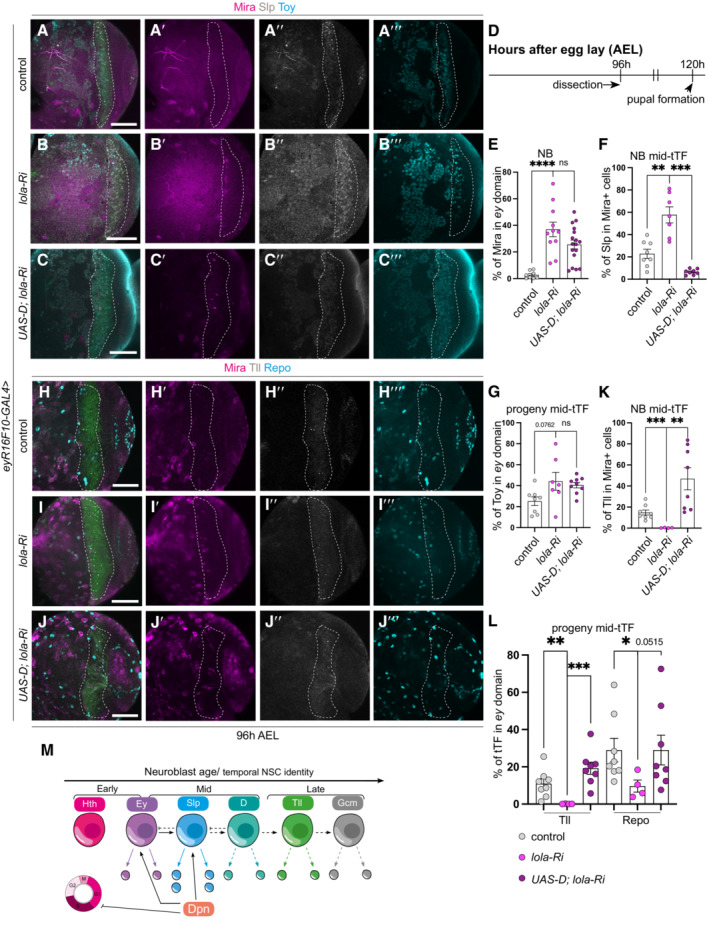
Figure 9. Dichaete re‐initiates the temporal series in dedifferentiated NBs caused by the loss of Lola.

-
A–C‴Representative images of the deep medulla neuronal layer in the larval optic lobe, in which control (UAS‐lacz), lola‐Ri, and UAS‐D; lola‐Ri are driven by eyR16F10‐GAL4 (outlined). Miranda (Mira, magenta), Sloppy‐paired (Slp, grey), Twin of eyeless (Toy, cyan). lola‐Ri induces ectopic Mira+neuroblasts (NBs) in the deep medulla layers, compared to control, quantified in (E). Dedifferentiated lola‐Ri NBs express excess Slp, fewer Tll, and slightly more Toy+ neurons compared to control. UAS‐D; lola‐Ri NBs express less Slp and similar amount of Toy in eyR16F10‐GAL4 domain compared to lola‐Ri alone, quantified in (F, G).
-
DTimeline depicting the age of ectopic neuroblasts (NBs). Larvae are dissected at 96 h AEL.
-
EQuantification of % Mira‐positive cells within eyR16F10‐GAL4 expression domain in control, lola‐Ri, and UAS‐D; lola‐Ri (calculated as the ratio of Mira+ cell volume as a percentage of total volume of eyR16F10‐GAL4 domain). Control n = 8, m = 2.717, ±0.9933, lola‐Ri n = 11, m = 36.95, ±5.447, UAS‐D; lola‐Ri n = 17, m = 25.57, ±3.303.
-
FQuantification of % Slp+ cells in Mira‐positive cells within the eyR16F10‐GAL4 expression domain in control, lola‐Ri, and UAS‐D; lola‐Ri (calculated as % of Slp+ cellular volume that are also Mira+ within eyR16F10‐GAL4 domain). Control n = 8, m = 22.80 ± 4.065, lola‐Ri n = 7, m = 57.68 ± 7.234, UAS‐D; lola‐Ri n = 8, m = 6.482 ± 0.8840.
-
GQuantification of % Toy+ cells within eyR16F10‐GAL4 expression domain in control, lola‐Ri, and UAS‐D; lola‐Ri (calculated as the ratio of Toy+ cellular volume as a percentage of total volume of eyR16F10‐GAL4 domain). Control n = 8, m = 25.14 ± 4.109, lola‐Ri n = 7, m = 44.16 ± 8.518, UAS‐D; lola‐Ri n = 9, m = 40.53 ± 2.633.
-
H–J‴Representative images of the deep medulla neuronal layer in the larval optic lobe, in which control (UAS‐lacz), lola‐Ri, and UAS‐D; lola‐Ri are driven by eyR16F10‐GAL4 (outlined). Miranda (Mira, magenta), Tailless (Tll, grey), Reversed polarity (Repo, cyan). lola‐Ri NBs express less Tll compared with control. There are fewer Tll+ and Repo+ progeny in the eyR16F10‐GAL4 domain in lola‐Ri compared to control. UAS‐D; lola‐Ri NBs express more Tll as well as more Tll+ and Repo+ progeny in eyR16F10‐GAL4 domain compared to lola‐Ri alone, quantified in (K, L).
-
KQuantification of % Tll+ cells in Mira‐positive cells within the eyR16F10‐GAL4 expression domain in control, lola‐Ri, and UAS‐D; lola‐Ri (calculated as % of Tll+ cellular volume that are also Mira+ within eyR16F10‐GAL4 domain). Control n = 8, m = 14.82 ± 2.400, lola‐Ri n = 4, m = 0.2982 ± 0.1217, UAS‐D; lola‐Ri n = 8, m = 46.85 ± 10.46.
-
LQuantification of % Tll+ and Repo cells within eyR16F10‐GAL4 expression domain in control, lola‐Ri, and UAS‐D; lola‐Ri (calculated as the ratio of Tll+ and Repo+ cellular volume as a percentage of total volume of eyR16F10‐GAL4 domain). Tll (Control n = 8, m = 10.94 ± 2.629, lola‐Ri n = 4, m = 0.1024 ± 0.05082, UAS‐D; lola‐Ri n = 8, m = 19.26 ± 3.264), Repo (Control n = 8, m = 28.95 ± 6.330, lola‐Ri n = 4, m = 9.648 ± 3.228, UAS‐D; lola‐Ri n = 8, m = 29.00 ± 7.984).
-
MUpon Dpn overexpression, ectopic NBs were induced. These ectopic NBs expressed the mid‐temporal tTF, Slp, and did not express early tTFs or late tTFs. Consequently, an excess of progeny was produced from the Slp+ temporal window at the expense of the progeny produced from late tTF time windows. DamID analysis demonstrated that Dpn directly bind to Ey and Slp, but not to Hth or Tll. Therefore, Dpn may be directly responsible for the increased expression of mid‐temporal identity TFs in dedifferentiated NBs at the expense of early or late temporal TFs.
Data information: Data are represented as mean ± SEM. P‐values were obtained performing unpaired t‐test, and Welch's correction was applied in case of unequal variances. ****P < 0.0001, ***P < 0.001, **P < 0.005, *P < 0.05. Scale bars: 50 μm.
