
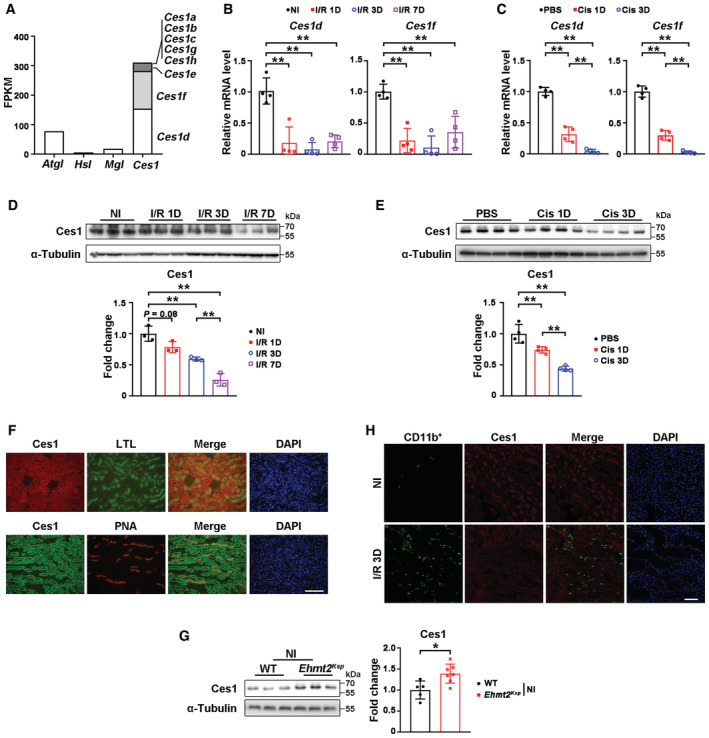
Figure EV3. Renal Ces1 location and alteration in mice with or without AKI injury.
-
AAbundance of lipolysis‐related genes in mouse kidney.
-
B, CmRNA levels of Ces1d and Ces1f in mice after I/R injury (B) or cisplatin‐induced AKI (C). Four mice per group.
-
D, ERepresentative immunoblots of Ces1 with quantitative results in the kidney from I/R injury‐induced AKI (n = 3 per group, D) or cisplatin‐induced AKI (n = 4 per group, E).
-
FRepresentative co‐immunofluorescent staining for Ces1 (red) with LTL (green) or Ces1 (green) with PNA (red) in non‐injured kidneys of WT mice. Scale bar = 100 μm.
-
GRepresentative immunoblots with quantitative results of renal Ces1 of WT (n = 5) and Ehmt2 Ksp (n = 7) mice.
-
HRepresentative co‐immunofluorescent staining for CD11b (green) with Ces1 (red) in non‐injured and I/R 3D injured kidneys. Scale bar = 50 μm.
Data information: FPKM, Fragments Per Kilobase of exon model per Million mapped fragments; NI, non‐injured. Cis, cisplatin; in (B–E and G), data were presented as means ± SD. Panels C, E were analyzed by 1‐way ANOVA followed by Tukey's test. Panel G was analyzed with 2‐tailed, unpaired Student's t test. Panels B, D were analyzed by Mann–Whitney U test. *P < 0.05; **P < 0.01.
Source data are available online for this figure.