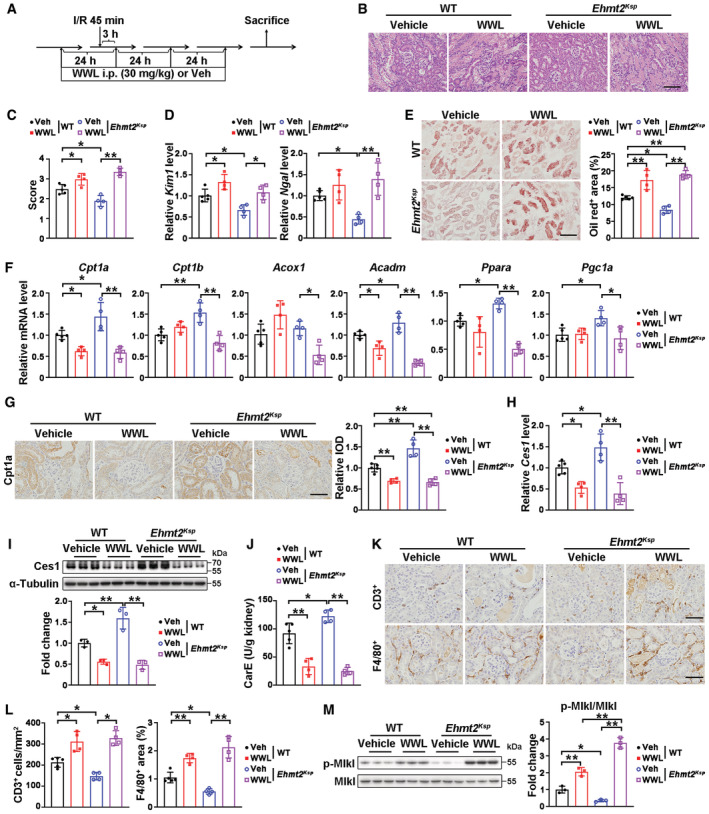
Figure 6. Ces1 inhibitor exacerbated I/R injury in WT mice and blocked the beneficial effects observed in Ehmt2 Ksp KO mice.

-
AExperimental design for WWL229 treatment in a renal I/R‐induced model. All the results shown in this figure were obtained under I/R 3D injury.
-
B, CRepresentative H&E images (B) with pathological scores (C) of WT + Veh (n = 5), WT + WWL (n = 4), Ehmt2 Ksp + Veh (n = 4) and Ehmt2 Ksp + WWL (n = 4) groups. Scale bar = 100 μm.
-
DmRNA levels of Kim1 and Ngal of WT + Veh (n = 5), WT + WWL (n = 4), Ehmt2 Ksp + Veh (n = 4) and Ehmt2 Ksp + WWL (n = 4) groups.
-
ERepresentative Oil Red O staining with quantification of WT + Veh (n = 5), WT + WWL (n = 4), Ehmt2 Ksp + Veh (n = 4) and Ehmt2 Ksp + WWL (n = 4) groups. Scale bar = 100 μm.
-
FmRNA levels of fatty acid oxidation related genes of WT + Veh (n = 5), WT + WWL (n = 4), Ehmt2 Ksp + Veh (n = 4) and Ehmt2 Ksp + WWL (n = 4) groups.
-
GRepresentative Cpt1a immunostaining with quantitative analysis in the kidneys of WT + Veh (n = 5), WT + WWL (n = 4), Ehmt2 Ksp + Veh (n = 4) and Ehmt2 Ksp + WWL (n = 4) groups. Scale bar = 50 μm. IOD, integral optical density.
-
H–JmRNA level of Ces1 of WT + Veh (n = 5), WT + WWL (n = 4), Ehmt2 Ksp + Veh (n = 4) and Ehmt2 Ksp + WWL (n = 4) groups (H); representative immunoblots with quantitative results of Ces1 of WT + Veh (n = 3), WT + WWL (n = 3), Ehmt2 Ksp + Veh (n = 3) and Ehmt2 Ksp + WWL (n = 3) groups (I); and carboxylesterase enzymatic activity (J) of WT + Veh (n = 5), WT + WWL (n = 4), Ehmt2 Ksp + Veh (n = 4) and Ehmt2 Ksp + WWL (n = 4) groups.
-
K, LRepresentative immunostaining for CD3 and F4/80 (K) and quantitative results (L) of WT + Veh (n = 5), WT + WWL (n = 4), Ehmt2 Ksp + Veh (n = 4) and Ehmt2 Ksp + WWL (n = 4) groups. Scale bar = 50 μm.
-
MRepresentative immunoblots (left) with quantitative results (right) of p‐Mlkl for WT + Veh (n = 3), WT + WWL (n = 3), Ehmt2 Ksp + Veh (n = 3) and Ehmt2 Ksp + WWL (n = 3) groups.
Data information: In (C–J, L and M), data were presented as means ± SD. Panels C–J, L (F4/80+) and M were analyzed by 1‐way ANOVA followed by Tukey's test. Pane L (CD3+) was analyzed by Mann–Whitney U test. *P < 0.05; **P < 0.01.
Source data are available online for this figure.
