
Figure 8. Atorvastatin intervention ameliorated renal I/R injury by reducing lipid accumulation via Ces1 and enhancing fatty acid oxidation.
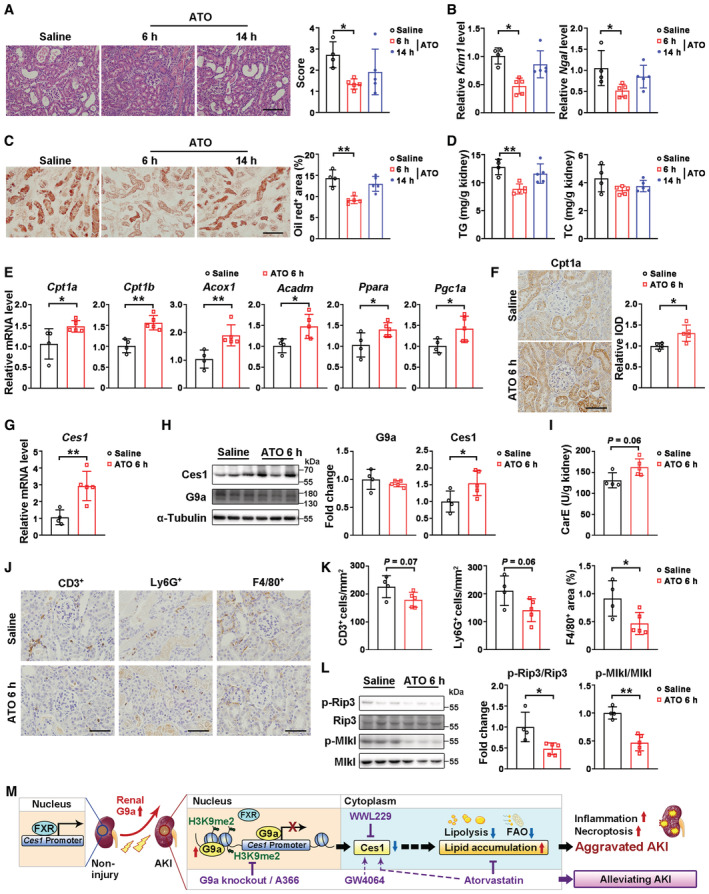
All the results shown in this figure were obtained under I/R 3D injury.
-
ARepresentative H&E staining (left) and pathological scores (right) of injured kidneys from mice received intervention treatment of saline (n = 4) or atorvastatin (20 mg/kg, i.g., first dose at 6‐h after ischemia, n = 5, or 14‐h after ischemia, n = 5). Scale bar = 100 μm.
-
BmRNA levels of Kim1 and Ngal of saline (n = 4), 6 h‐ATO (n = 5) and 14 h‐ATO (n = 5) groups.
-
C, DRepresentative Oil Red O staining with quantification (C, scale bar = 100 μm), renal triglyceride and cholesterol levels (D) of saline (n = 4), 6 h‐ATO (n = 5) and 14 h‐ATO (n = 5) groups.
-
EmRNA levels of fatty acid oxidation related genes of saline (n = 4) and 6 h‐ATO (n = 5).
-
FRepresentative Cpt1a immunostaining with quantitative analysis in the kidneys of saline (n = 4) and 6 h‐ATO (n = 5) groups. Scale bar = 50 μm. IOD, integral optical density.
-
G–ImRNA levels of Ces1 (G), representative immunoblots (H, left) with quantitative results (H, right) of Ces1 and G9a, and carboxylesterase enzymatic activity (I) of saline (n = 4) and 6 h‐ATO (n = 5).
-
J, KRepresentative immunostaining for CD3, Ly6G, and F4/80 (J) and quantitative results (K) of indicated groups. Scale bar = 50 μm.
-
LRepresentative immunoblots (left) with quantitative results (right) of p‐Rip3 and p‐Mlkl for saline (n = 4) and 6 h‐ATO (n = 5).
-
MA schematic representation of the mechanistic model.
Data information: In (A–I, K and L), data were presented as means ± SD. Panels A, B (Ngal), C, and D were analyzed by 1‐way ANOVA followed by Tukey's test. Panels E (except Cpt1a and Acox1), F–H, K and L were analyzed with 2‐tailed, unpaired Student's t test. Panels B (Kim1), E (Cpt1a and Acox1) and I were analyzed by Mann–Whitney U test. *P < 0.05; **P < 0.01.
Source data are available online for this figure.