. 2023 May 26;5(3):e220180. doi: 10.1148/rycan.220180

Figure 4:

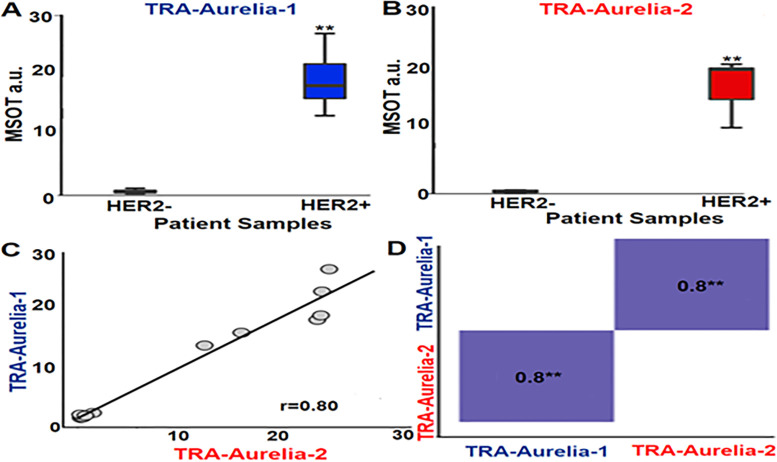
(A) Box plot shows a significantly higher trastuzumab (TRA)-Aurelia-1 uptake (mean, 19.25 ± 0.667; max, 1.2; min: 13.3) in human epidermal growth factor receptor 2 (HER2)–positive human breast tumors compared with HER2-negative tumors (P = .002 using Kruskal-Wallis test). (B) Box plot shows a significantly higher TRA-Aurelia-2 uptake (mean, 16.16 ± 4.793; max, 20.6; min, 10.7) in HER2-positive tumor tissue in comparison with HER2-negative tumors (P = .002 using Kruskal-Wallis test). Error bars describe 95% CI for each data point. (C, D) Pearson correlation curve data for TRA-Aurelia-1 and TRA-Aurelia-2 uptake in HER2 tumors shows significant correlation (r = 0.8, P = .002). ** = P < .01, a.u. = arbitrary units, MSOT = multispectral optoacoustic tomography.

(A) Box plot shows a significantly higher trastuzumab (TRA)-Aurelia-1 uptake (mean, 19.25 ± 0.667; max, 1.2; min: 13.3) in human epidermal growth factor receptor 2 (HER2)–positive human breast tumors compared with HER2-negative tumors (P = .002 using Kruskal-Wallis test). (B) Box plot shows a significantly higher TRA-Aurelia-2 uptake (mean, 16.16 ± 4.793; max, 20.6; min, 10.7) in HER2-positive tumor tissue in comparison with HER2-negative tumors (P = .002 using Kruskal-Wallis test). Error bars describe 95% CI for each data point. (C, D) Pearson correlation curve data for TRA-Aurelia-1 and TRA-Aurelia-2 uptake in HER2 tumors shows significant correlation (r = 0.8, P = .002). ** = P < .01, a.u. = arbitrary units, MSOT = multispectral optoacoustic tomography.