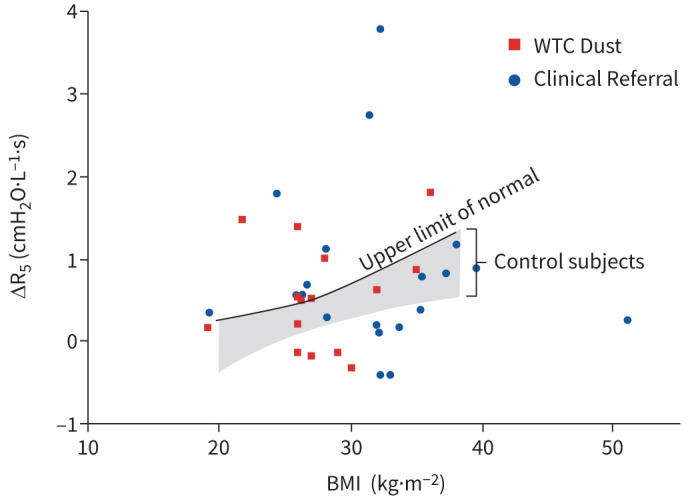
FIGURE 2.

The maximum change in R5 following exercise is plotted as a function of body mass index (BMI). The shaded area depicts the predicted values and the 95% confidence interval for maximum change in R5 derived in Controls. Data points above the shaded area indicate individuals with hyperreactivity identified by R5. WTC: World Trade Center.
