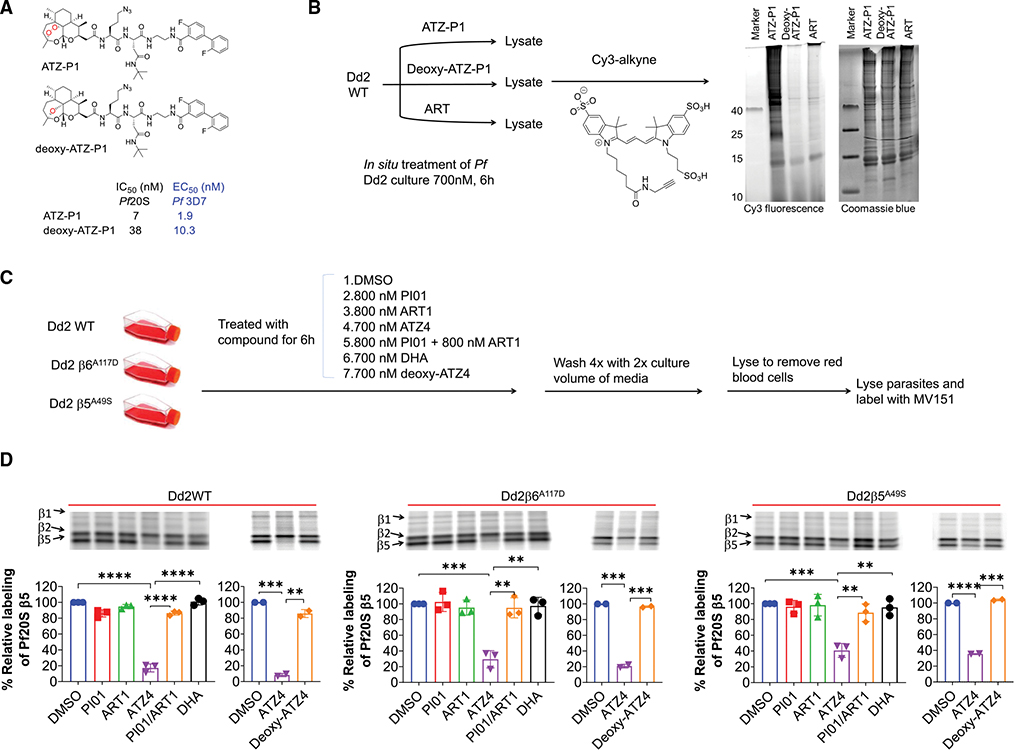
Figure 5. Mode of action of ATZ in P. falciparum.
(A) Structures of ATZ-P1 and deoxy-ATZ-P1 and their enzyme inhibition and parasite growth inhibition activities.
(B) Pf Dd2 parasites were treated with ATZ-P1, deoxy-ATZ-P1, and ART at 700 nM for 6 h. Equal amounts of the parasite lysates were reacted with Cy3-alkyne for 1 h and resolved on an SDS-PAGE gel. Fluorescence signals were recorded on a fluorescence scanner (left) and the loading control was shown by Coomassie blue (right).
(C) Scheme of experiment design. Parasites were treated with DMSO, PI01, WZ1840, ATZ4, PI01/ART1 (1:1), DHA, or deoxy-ATZ4 at indicated concentrations for 6 h and compounds were then washed off before hypotonic lysis of red blood cells. Parasites were then lysed and labeled with MV151.
(D) Fluorescent scanning images of representative SDS-PAGE gels of Pf20S labeling by MV151 of samples in (C). Quantification of labeling was performed with ImageJ. Percentages of labeling inhibition were calculated by normalizing the ratios of density of β2/β5 bands to that of DMSO treated. Data are means ± standard error of two or three independent experiments. p values of unpaired two-tailed t-tests between the DMSO and ATZ4 groups, ATZ4 and PI01/ART1 groups, and ATZ4 and deoxy-ATZ4 groups were performed in GraphPad Prism (version 9.4.0). **p < 0.005, ***p < 0.0005 and ****p < 0.0001.

