
Figure 4.
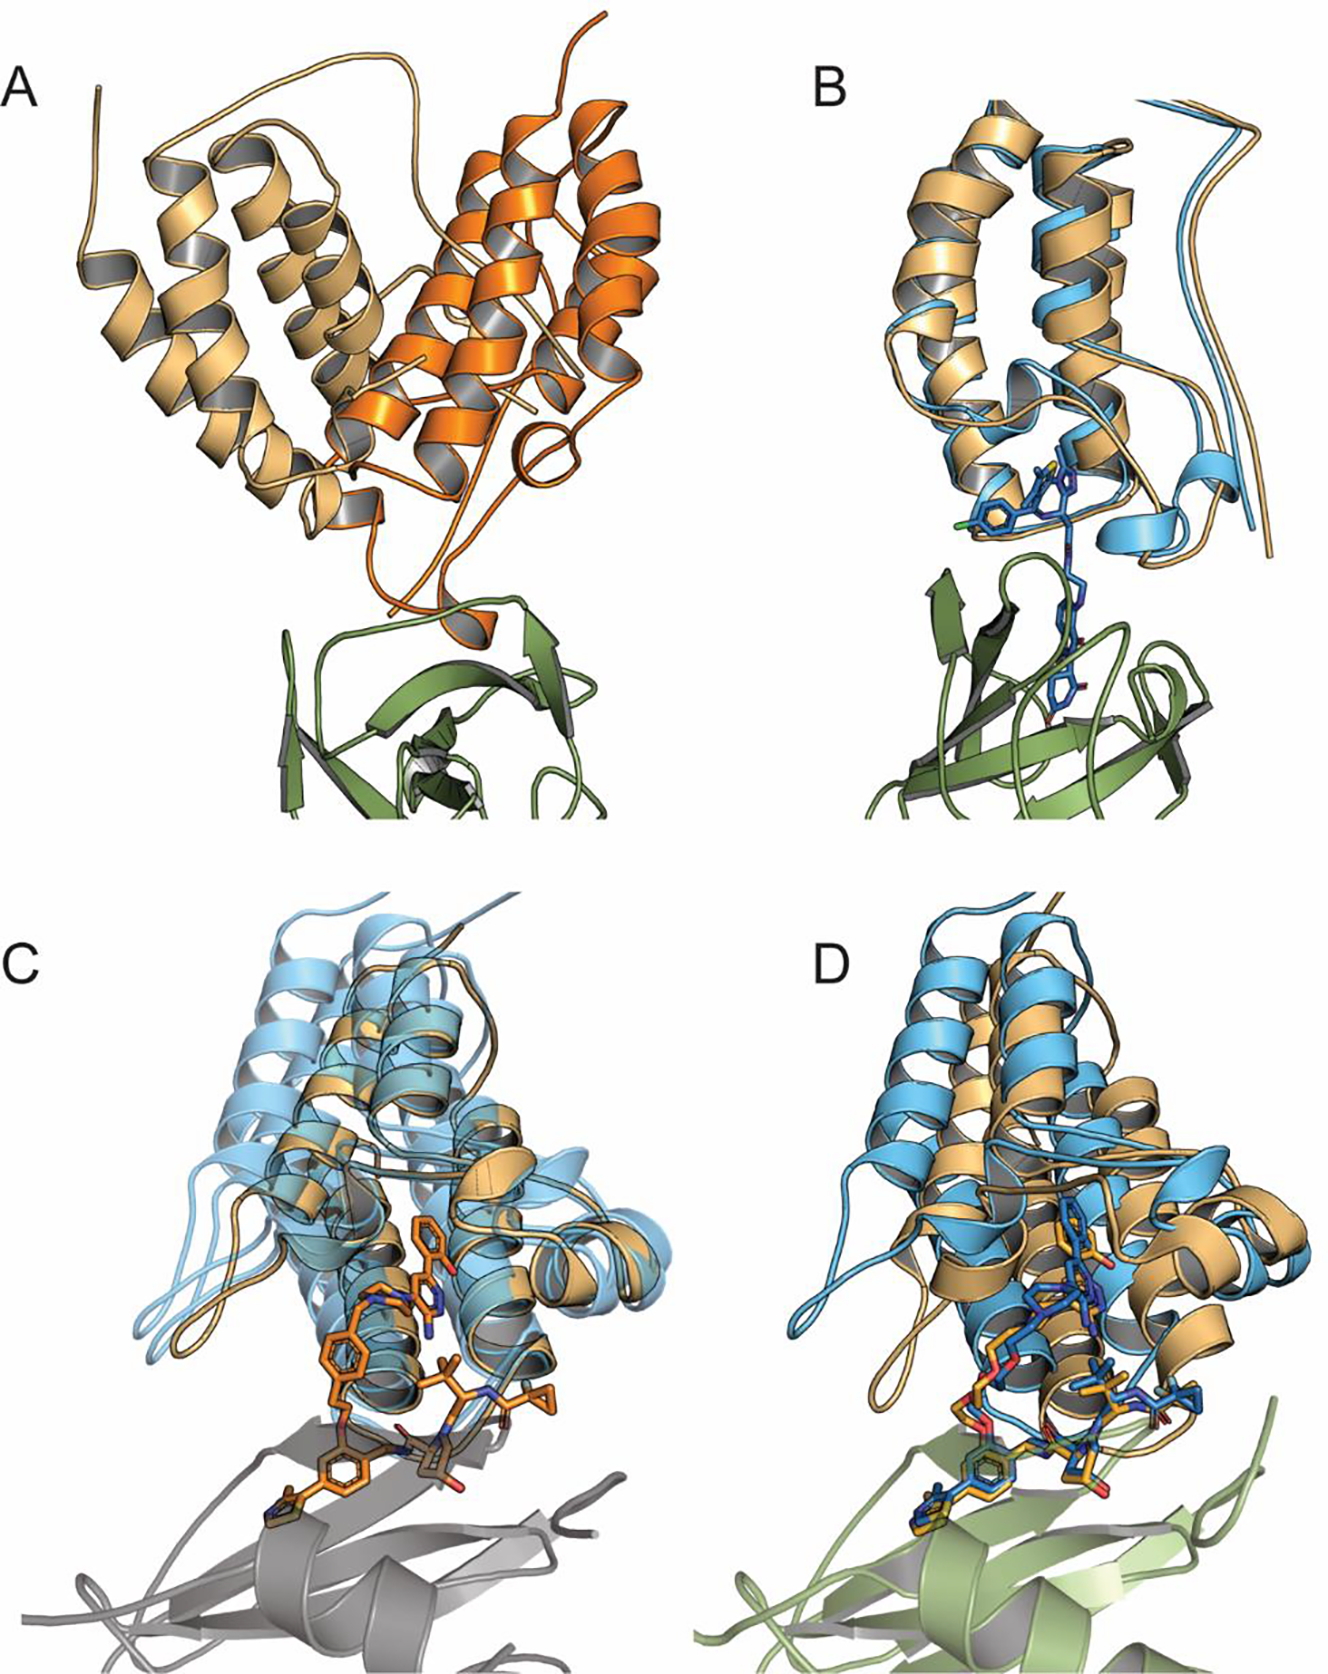
Models of CRBN–dBET57– BRD4BD1 and VHL- PROTAC1/2-SMARCA2/4 complexes. (A) Superposing the best model (model 5) of CRBN–dBET57– BRD4 BD1 (light orange) and the consensus prediction of CRBN–dBET23– BRD4 BD1 (bright orange) to show that they substantially differ. (B) Model 5 of CRBN–dBET57– BRD4 BD1 (blue), superimposed on its X-ray structure (orange, PDB ID: 6BNB). (C) Superimposing the best model (model 2) of VHL- PROTAC2-SMARCA2 (orange) at the center of the consensus cluster and the consensus models of VHL- PROTAC1-SMARCA2 and VHL- PROTAC2-SMARCA4, both shown in transparent blue color. (D) Superimposing the consensus prediction (model 5) of VHL- PROTAC1-SMARCA2 (blue) and its X-ray structure (orange, PDB ID: 5NVX)