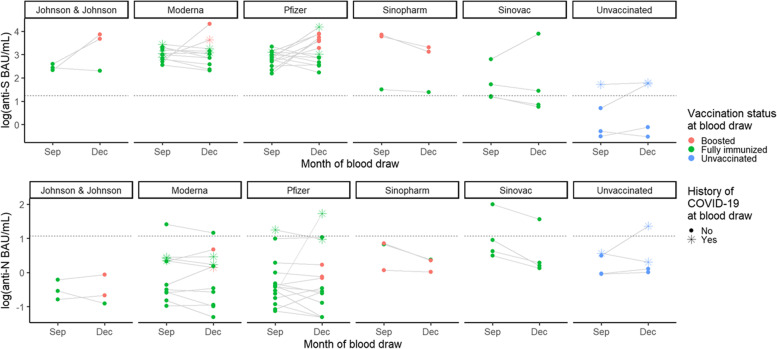
Fig. 5.
Paired sera results for students who participated during the investigation’s September and December time points — fall academic semester 2021, Wisconsin. Top panel displays the levels of antibody targeting the spike protein of SARS-CoV-2 (anti-S) and the bottom panel displays the levels of antibody targeting the nucleocapsid protein (anti-N), both in WHO-standardized binding antibody units per milliliter (BAU/mL), log (10) scale. Month of blood draw is presented on the x-axis. Sera values are categorized based on previous history of COVID-19 illness (shape) and vaccination status (color) at blood draw. Horizontal dashed lines indicate the assay threshold of positivity

