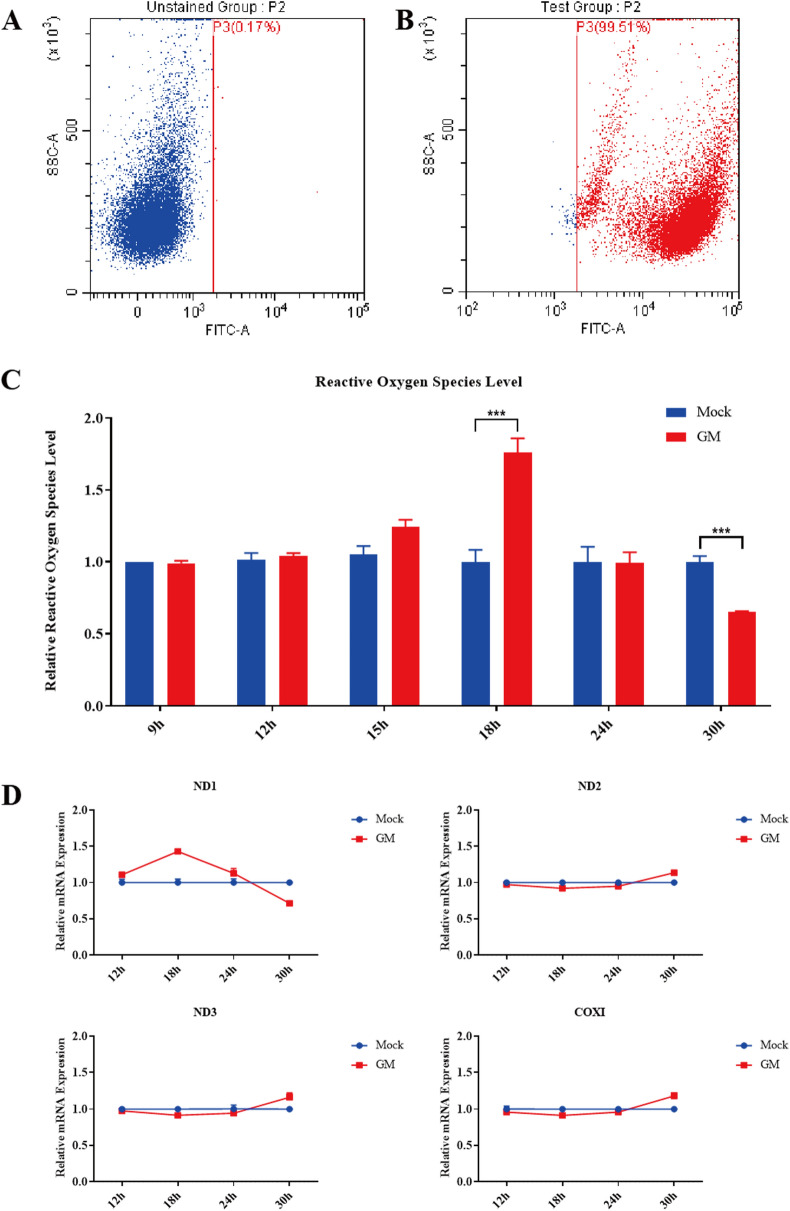
Figure 6.
ROS levels and mtDNA copy number in NDV-infected DF-1 cells. A and B DF-1 cells treated with DCFH-DA were assessed for DCF fluorescence by flow cytometry. C ROS levels were measured by DCF fluorescence in NDV-infected or mock-treated DF-1 cells. Shown are the relative ratios of ROS levels at indicated time points. D Changes in copy number of mitochondrial ND1, ND2, ND3, and COXI genes in NDV-infected DF-1 cells. Similar results were obtained from three independent experiments. Data were expressed as mean ± SD. *P ≤ 0.05; **P ≤ 0.01; ***P ≤ 0.001. NDV: Newcastle disease virus, CQ: chloroquine, 3-MA: 3-Methyladenine, MOI: Multiplicity of infection.

