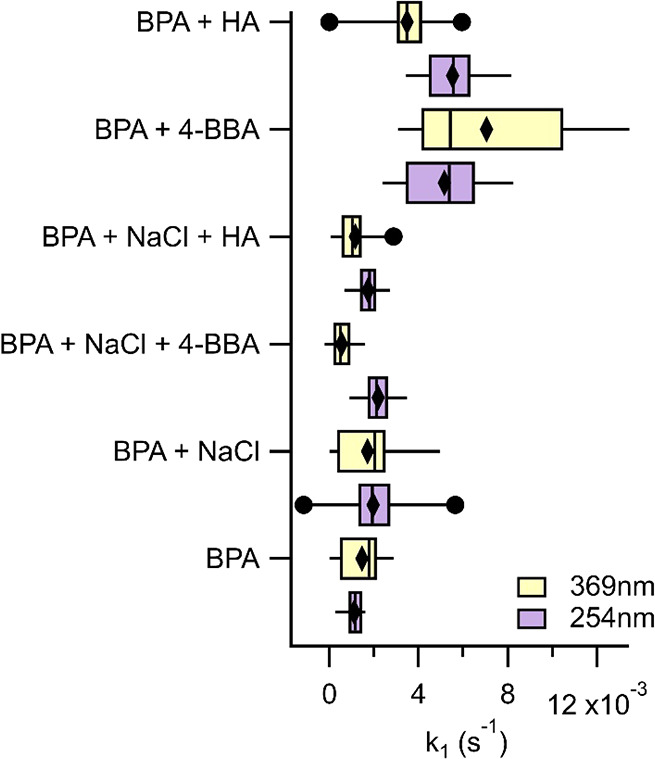
Figure 4.

First-order loss rates of BPA for the different aerosol systems following exposure to 369 nm light (yellow boxes) and 254 nm light (purple boxes). Median values are shown by the horizontal line, the 25th and 75th percentiles are bounded by the box, the 5th and 95th percentiles are shown by the whiskers, the black diamonds represent the mean, and the black dots represent the outliers. N = 15 for each aerosol system.
