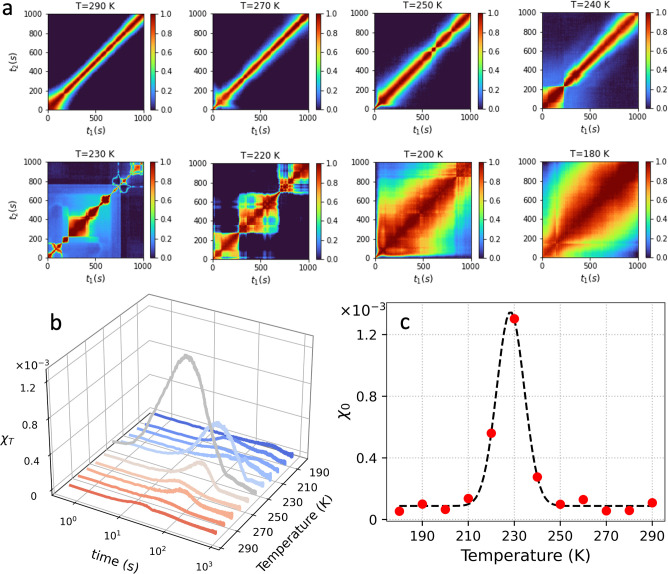
Figure 3.
(a) Two-time correlation function (TTC) at different temperatures indicated in the panel titles at momentum transfer Q = 0.1 nm–1. (b) The normalized variance χT at different temperatures extracted from the TTC. (c) The maximum of the normalized variance χ0 obtained at different temperatures indicates a maximum at T = 227 K.

