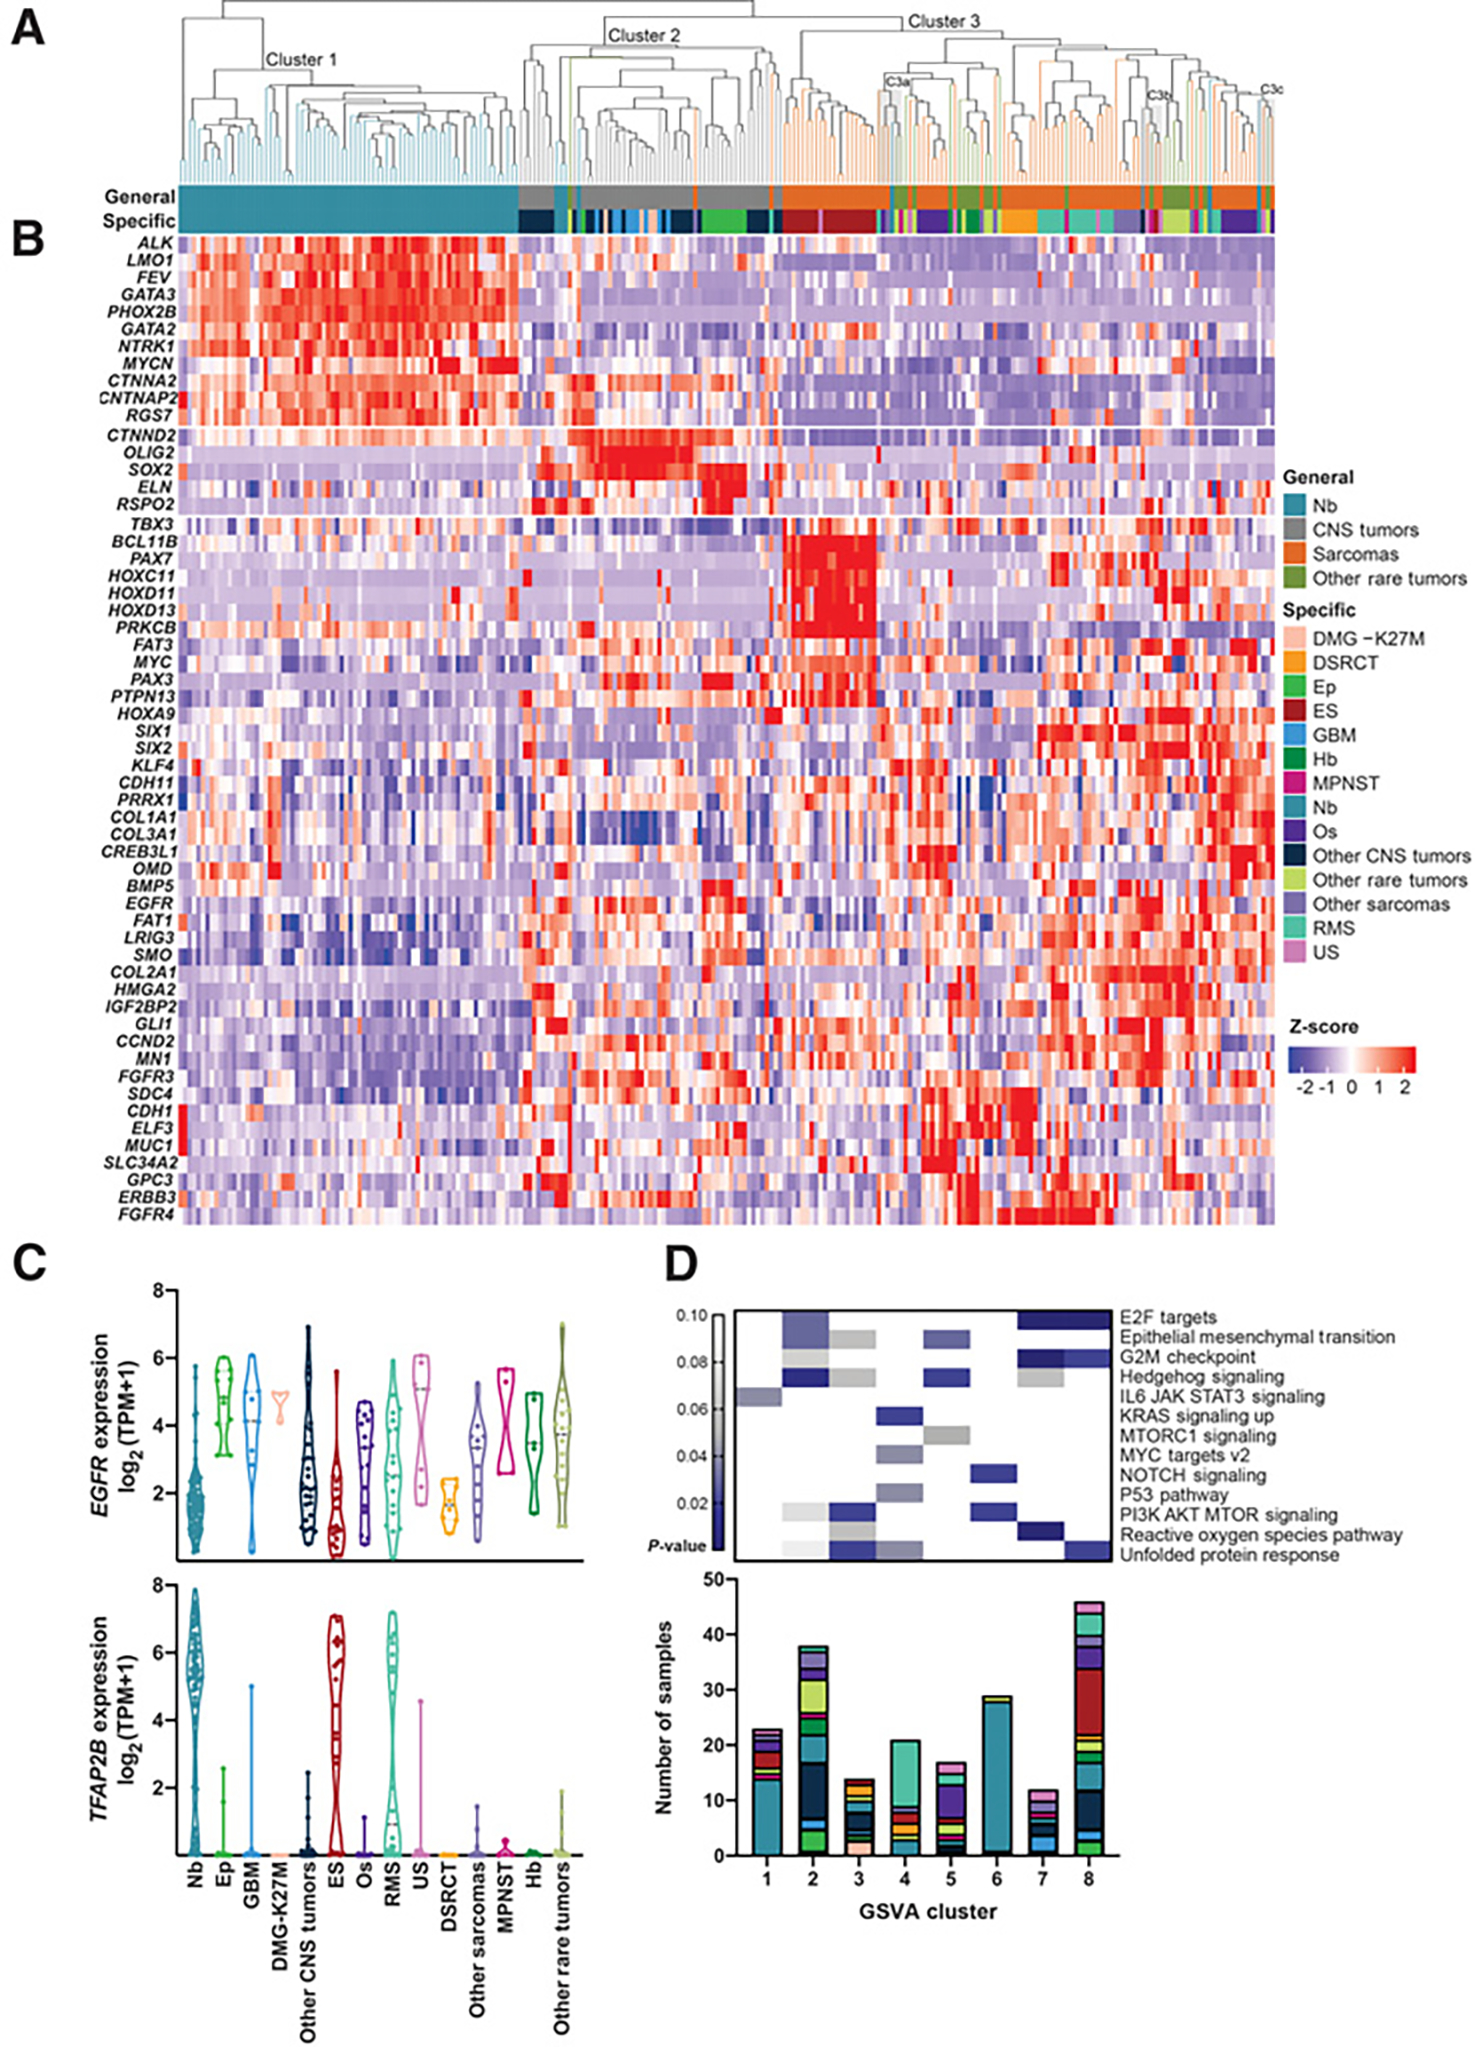
Figure 4.

Gene expression patterns in relapsed and refractory childhood solid tumors. A, Unsupervised hierarchical clustering using 2,199 genes. Three main clusters were formed (Cluster 1, Cluster 2, Cluster 3). Three mixed-pathology subclusters within Cluster 3 with P values < 0.05 (C3a, C3b, and C3c) are shaded in gray. B, Heatmap of genes that are significantly differentially expressed in one group versus two others. COSMIC genes are represented here. C, EGFR and TFAP2B as selected examples of genes with cross-pathology expression patterns. D, P values for enrichment of cancer hallmark gene sets within the consensus clustered tumor groups (GSVA clusters 1–8; top). Hallmarks with significant enrichment within at least one group are shown. Tumor types associated with each GSVA cluster (bottom). Colors correspond to the specific tumor types as displayed in the legend for A.
