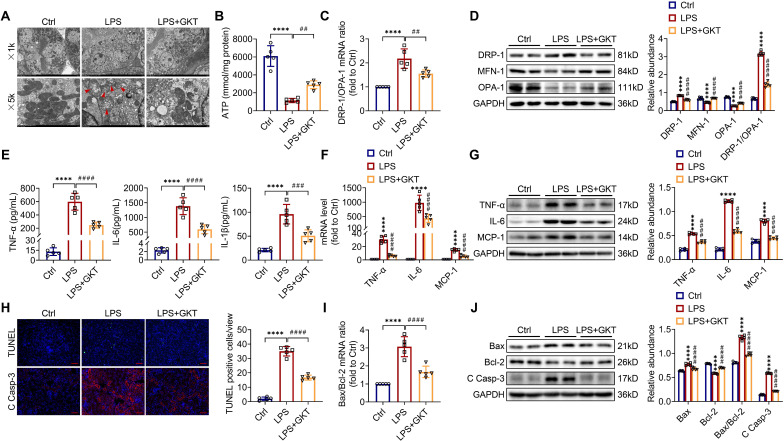
Figure 4.
NOX4 inhibitor GKT137831 treatment suppressed LPS-induced kidney mitochondrial dysfunction, inflammation and cell apoptosis in mice. (A) Representative photomicrographs of mitochondria in RTECs collected by transmission electron microscopy (×1000, scale bars = 10 μm; ×5000, scale bars = 2 μm). The red triangle indicates injured mitochondria. (B) ATP production in renal tissues detected using assay kits. (C) Gene expression ratio of DRP-1/OPA-1 in renal tissues measured by RT‒qPCR. (D) DRP-1, MFN-1 and OPA-1 protein expression in the kidneys was analyzed by western blot analysis and quantified by densitometry. (E) Serum levels of TNF-α, IL-6 and IL-1β determined using ELISA kits. (F) Renal mRNA levels of TNF-α, IL-6 and MCP-1 measured by RT‒qPCR. (G) The protein expression levels of TNF-α, IL-6 and MCP-1 in kidneys were analyzed by western blot analysis and quantified by densitometry. (H) Representative images of TUNEL staining and immunofluorescence staining of C Casp-3 (×200, scale bars = 50 μm) and quantification of TUNEL-positive cells in the kidney cortex. (I) Gene expression ratio of Bax/Bcl-2 in renal tissues measured by RT‒qPCR. (J) The protein expression levels of Bax, Bcl-2 and C Casp-3 in the kidneys were analyzed by western blot analysis and quantified by densitometry. Data are represented as the mean ± SD, n = 5. ****P < 0.0001 vs Ctrl; ##P < 0.01, ###P < 0.001, ####P < 0.0001 vs LPS.

