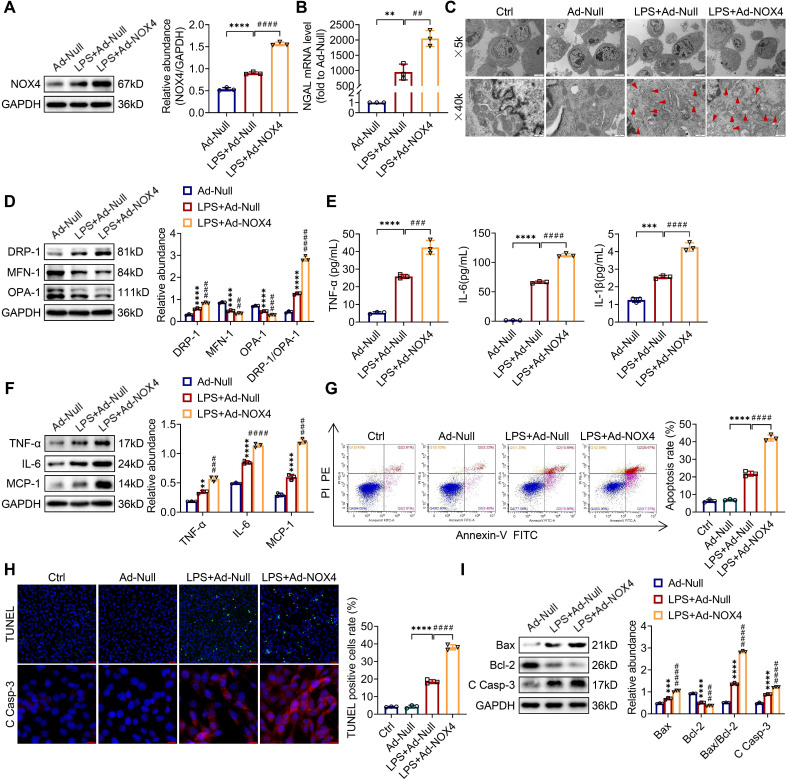
Figure 7.
NOX4 overexpression worsened mitochondrial dysfunction, inflammation and apoptosis in LPS-stimulated TCMK-1 cells. (A) Western blot analysis and quantification by densitometry of NOX4 in each group of TCMK-1 cells. (B) NGAL mRNA expression in TCMK-1 cells measured by RT‒qPCR. (C) Representative photomicrographs of mitochondria in TCMK-1 cells collected by transmission electron microscopy (×5000, scale bars = 5 μm; ×40000, scale bars = 500 nm). The red triangle indicates injured mitochondria. (D) The protein expression levels of DRP-1, MFN-1 and OPA-1 in TCMK-1 cells were analyzed by western blot analysis and quantified by densitometry. (E) The cell supernatant levels of TNF-α, IL-6 and IL-1β determined using assay kits. (F) The protein expression levels of TNF-α, IL-6 and MCP-1 in TCMK-1 cells were analyzed by western blot analysis and quantified by densitometry. (G) Representative flow cytometric plots of TCMK-1-cell apoptosis and quantification of the apoptosis rate. (H) Representative images of TUNEL staining (×200, scale bars = 50 μm) and immunofluorescence staining of C Casp-3 (×400, scale bars = 20 μm) and the percentage of TUNEL-positive TCMK-1 cells. (I) The protein expression levels of Bax, Bcl-2 and C Casp-3 in TCMK-1 cells were analyzed by western blot analysis and quantified by densitometry. Data are represented as the mean ± SD, n = 3. **P < 0.01, ***P < 0.001, ****P < 0.0001 vs Ad-Null; ##P < 0.01, ###P < 0.001, ####P < 0.0001 vs LPS + Ad-Null.

