Figure 1.
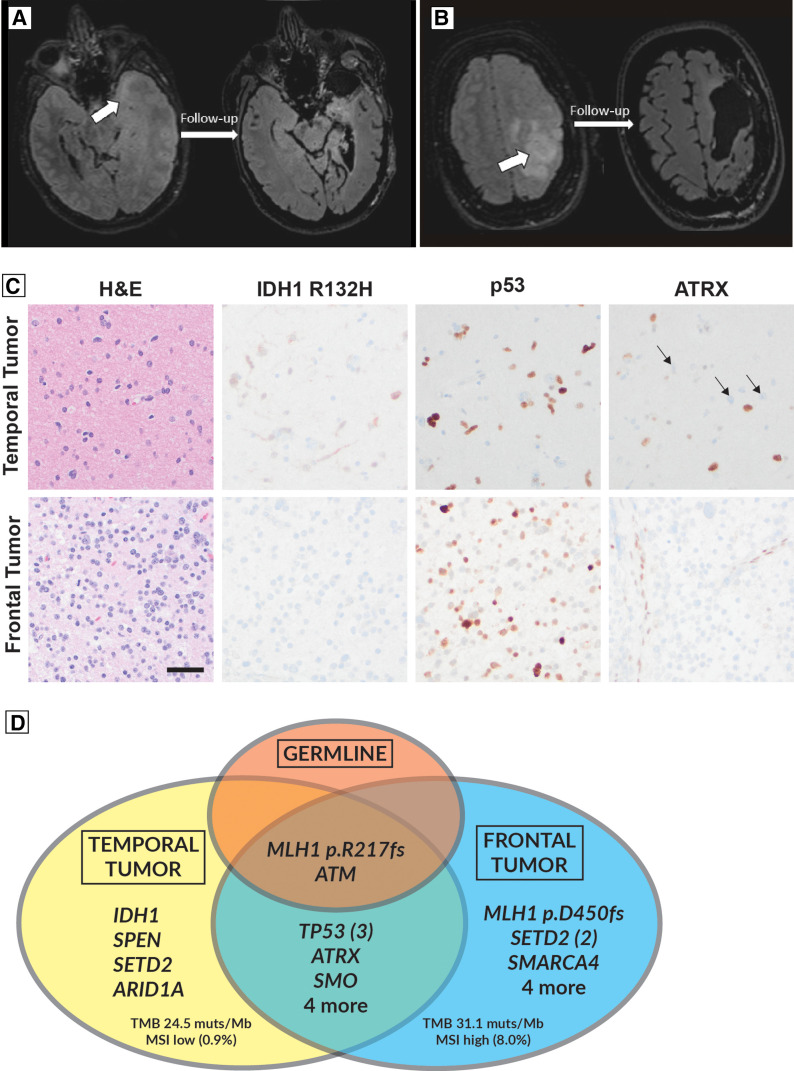
(A) Preoperative (left) and postoperative (right) FLAIR sequence showing T2 hyperintensity in the anterior medial temporal lesion (arrow) before and after resection. (B) Demonstrates a similar appearing lesion involving the left frontal precentral gyrus. (C) Hematoxylin and eosin (H&E) and immunohistochemical staining of temporal and frontal tumor samples. Neither sample displayed microvascular proliferation or necrosis. Note the absence of IDH1 R132H staining in the frontal tumor sample and the ATRX loss and positive p53 stain in tumor tissue from both tumor sites. (D) Venn diagram depicting shared and distinct mutations of the somatic (tumoral) and germline (nontumoral) tissue samples. Scale bar: 50 microns, applies to all panels (C).

