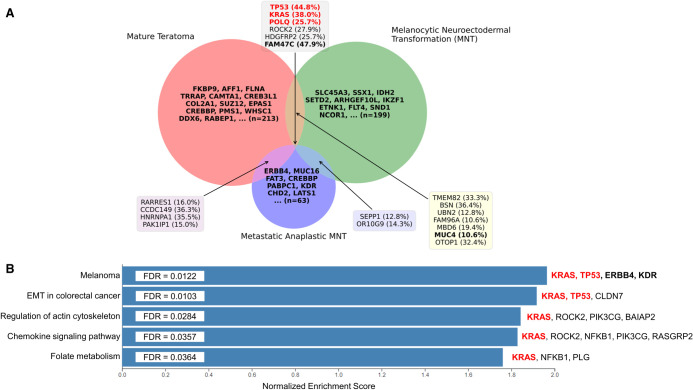
Figure 3.
Somatic mutation profile of the mature teratoma, melanocytic neuroectodermal transformation (MNT), and metastatic anaplastic MNT. (A) Venn diagram analysis of the three different components showing six mutations shared by the three different component and 13 mutations common to at least two components. Variant allele frequencies are indicated in brackets. (B) Gene set enrichment analysis (GSEA) using Wikipathway reveals a significant normalized enrichment score in the melanoma pathway. For A and B, genes involved in oncogenesis according to the COSMIC database are indicated in bold. The oncogenic specific mutations appear in red.

