. 2022 Dec 25;39(4):415–420. doi: 10.5511/plantbiotechnology.22.0823a

Figure 2. ROS production by dose-dependence treatment of flg22 in N. benthamiana, Arabidopsis, and turnip. Left panels show schematic RLU for 60 min after mock or flg22 treatment. Right panels show total RLU for 60 min after mock or flg22 treatment. Concentrations of flg22 are indicated. Data are presented as means±SD (n=8, biological replicates). Asterisks (Student’s t-test, * p<0.01) indicate statistically significant differences to mock treatment. NS, not significant.
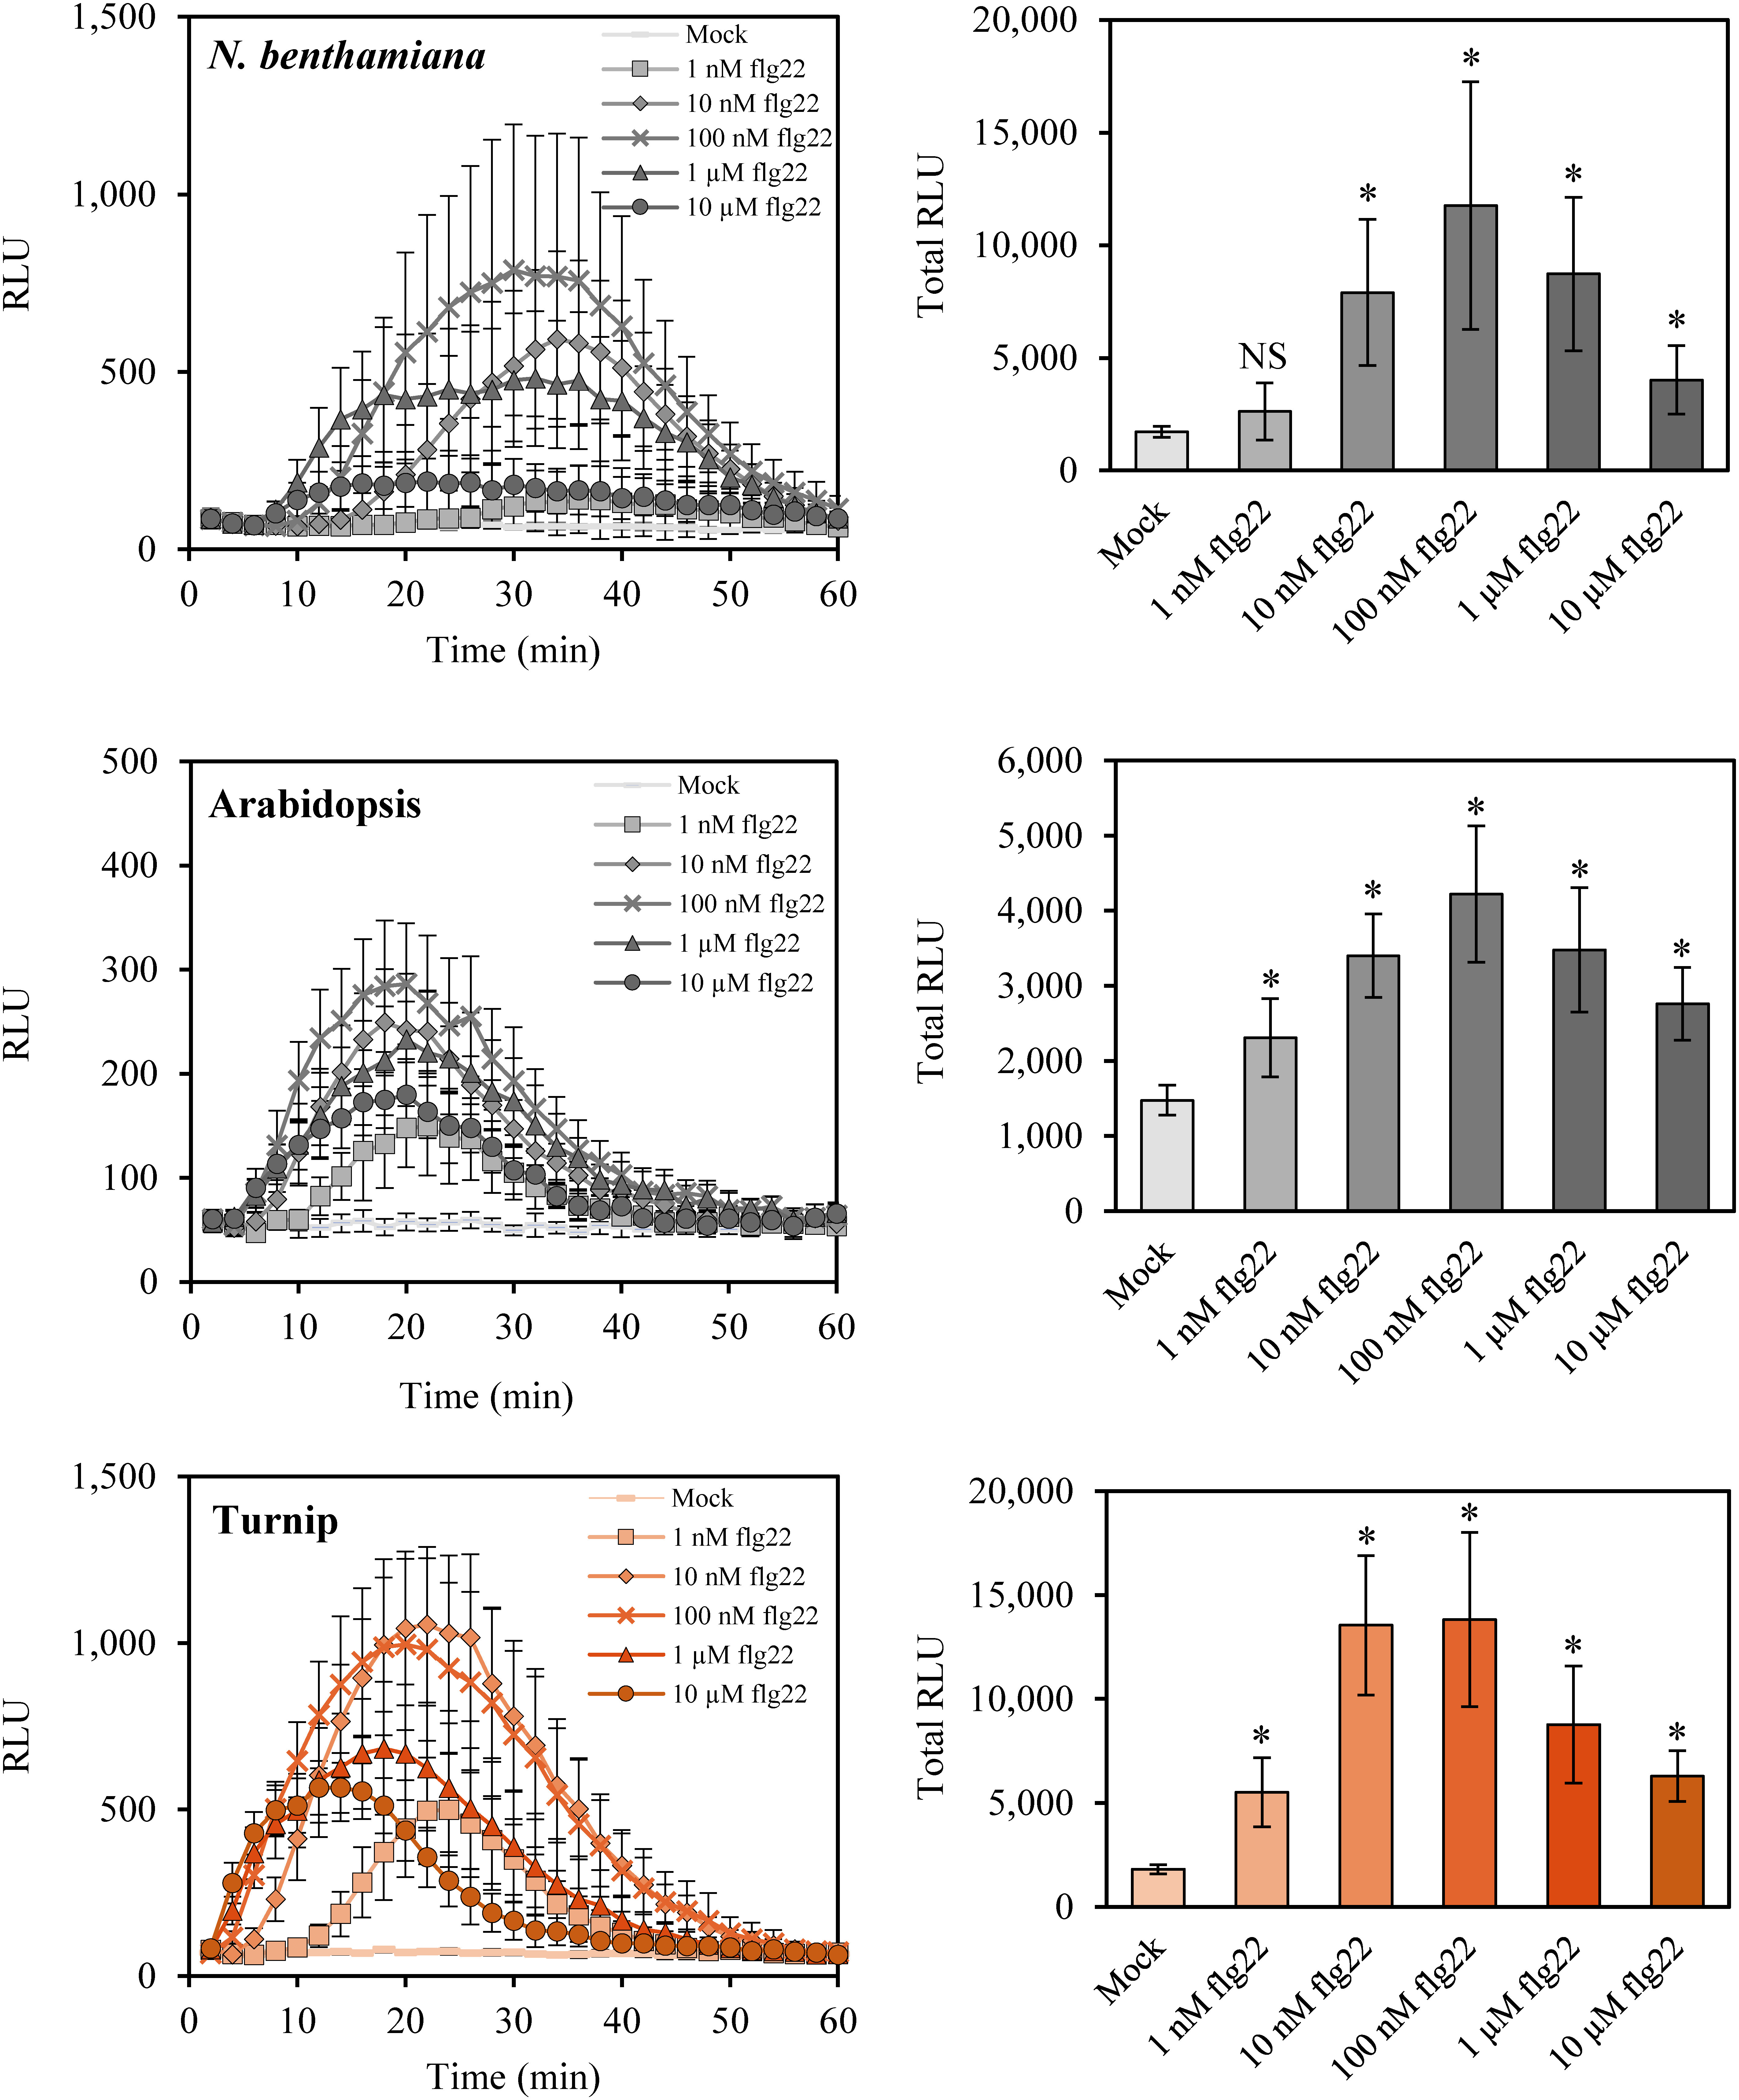
Figure 2. ROS production by dose-dependence treatment of flg22 in N. benthamiana, Arabidopsis, and turnip. Left panels show schematic RLU for 60 min after mock or flg22 treatment. Right panels show total RLU for 60 min after mock or flg22 treatment. Concentrations of flg22 are indicated. Data are presented as means±SD (n=8, biological replicates). Asterisks (Student’s t-test, * p<0.01) indicate statistically significant differences to mock treatment. NS, not significant.