. 2022 Dec 25;39(4):415–420. doi: 10.5511/plantbiotechnology.22.0823a

Figure 3. Normalized RLU after removal of background when 100 nM flg22 was treated to N. benthamiana, Arabidopsis, and turnip. (A–C) Normalized RLU for 60 min after 100 nM flg22 treatment in triplicate experiments of N. benthamiana (A), Arabidopsis (B), and turnip (C). For each time point, normalized RLU value was obtained by subtraction of the background RLU value of mock treatment from the RLU value of 100 nM flg22 treatment. Each graph shows three individual tests. (D) Total normalized RLU of the three plant species. Each number under the horizontal axis indicates the replicate number of (A–C). Data are presented as average±SD (n=8, biological replicates). Significance was analyzed by one-way ANOVA and Tukey HSD test. Different letters indicate significant differences (p<0.05).
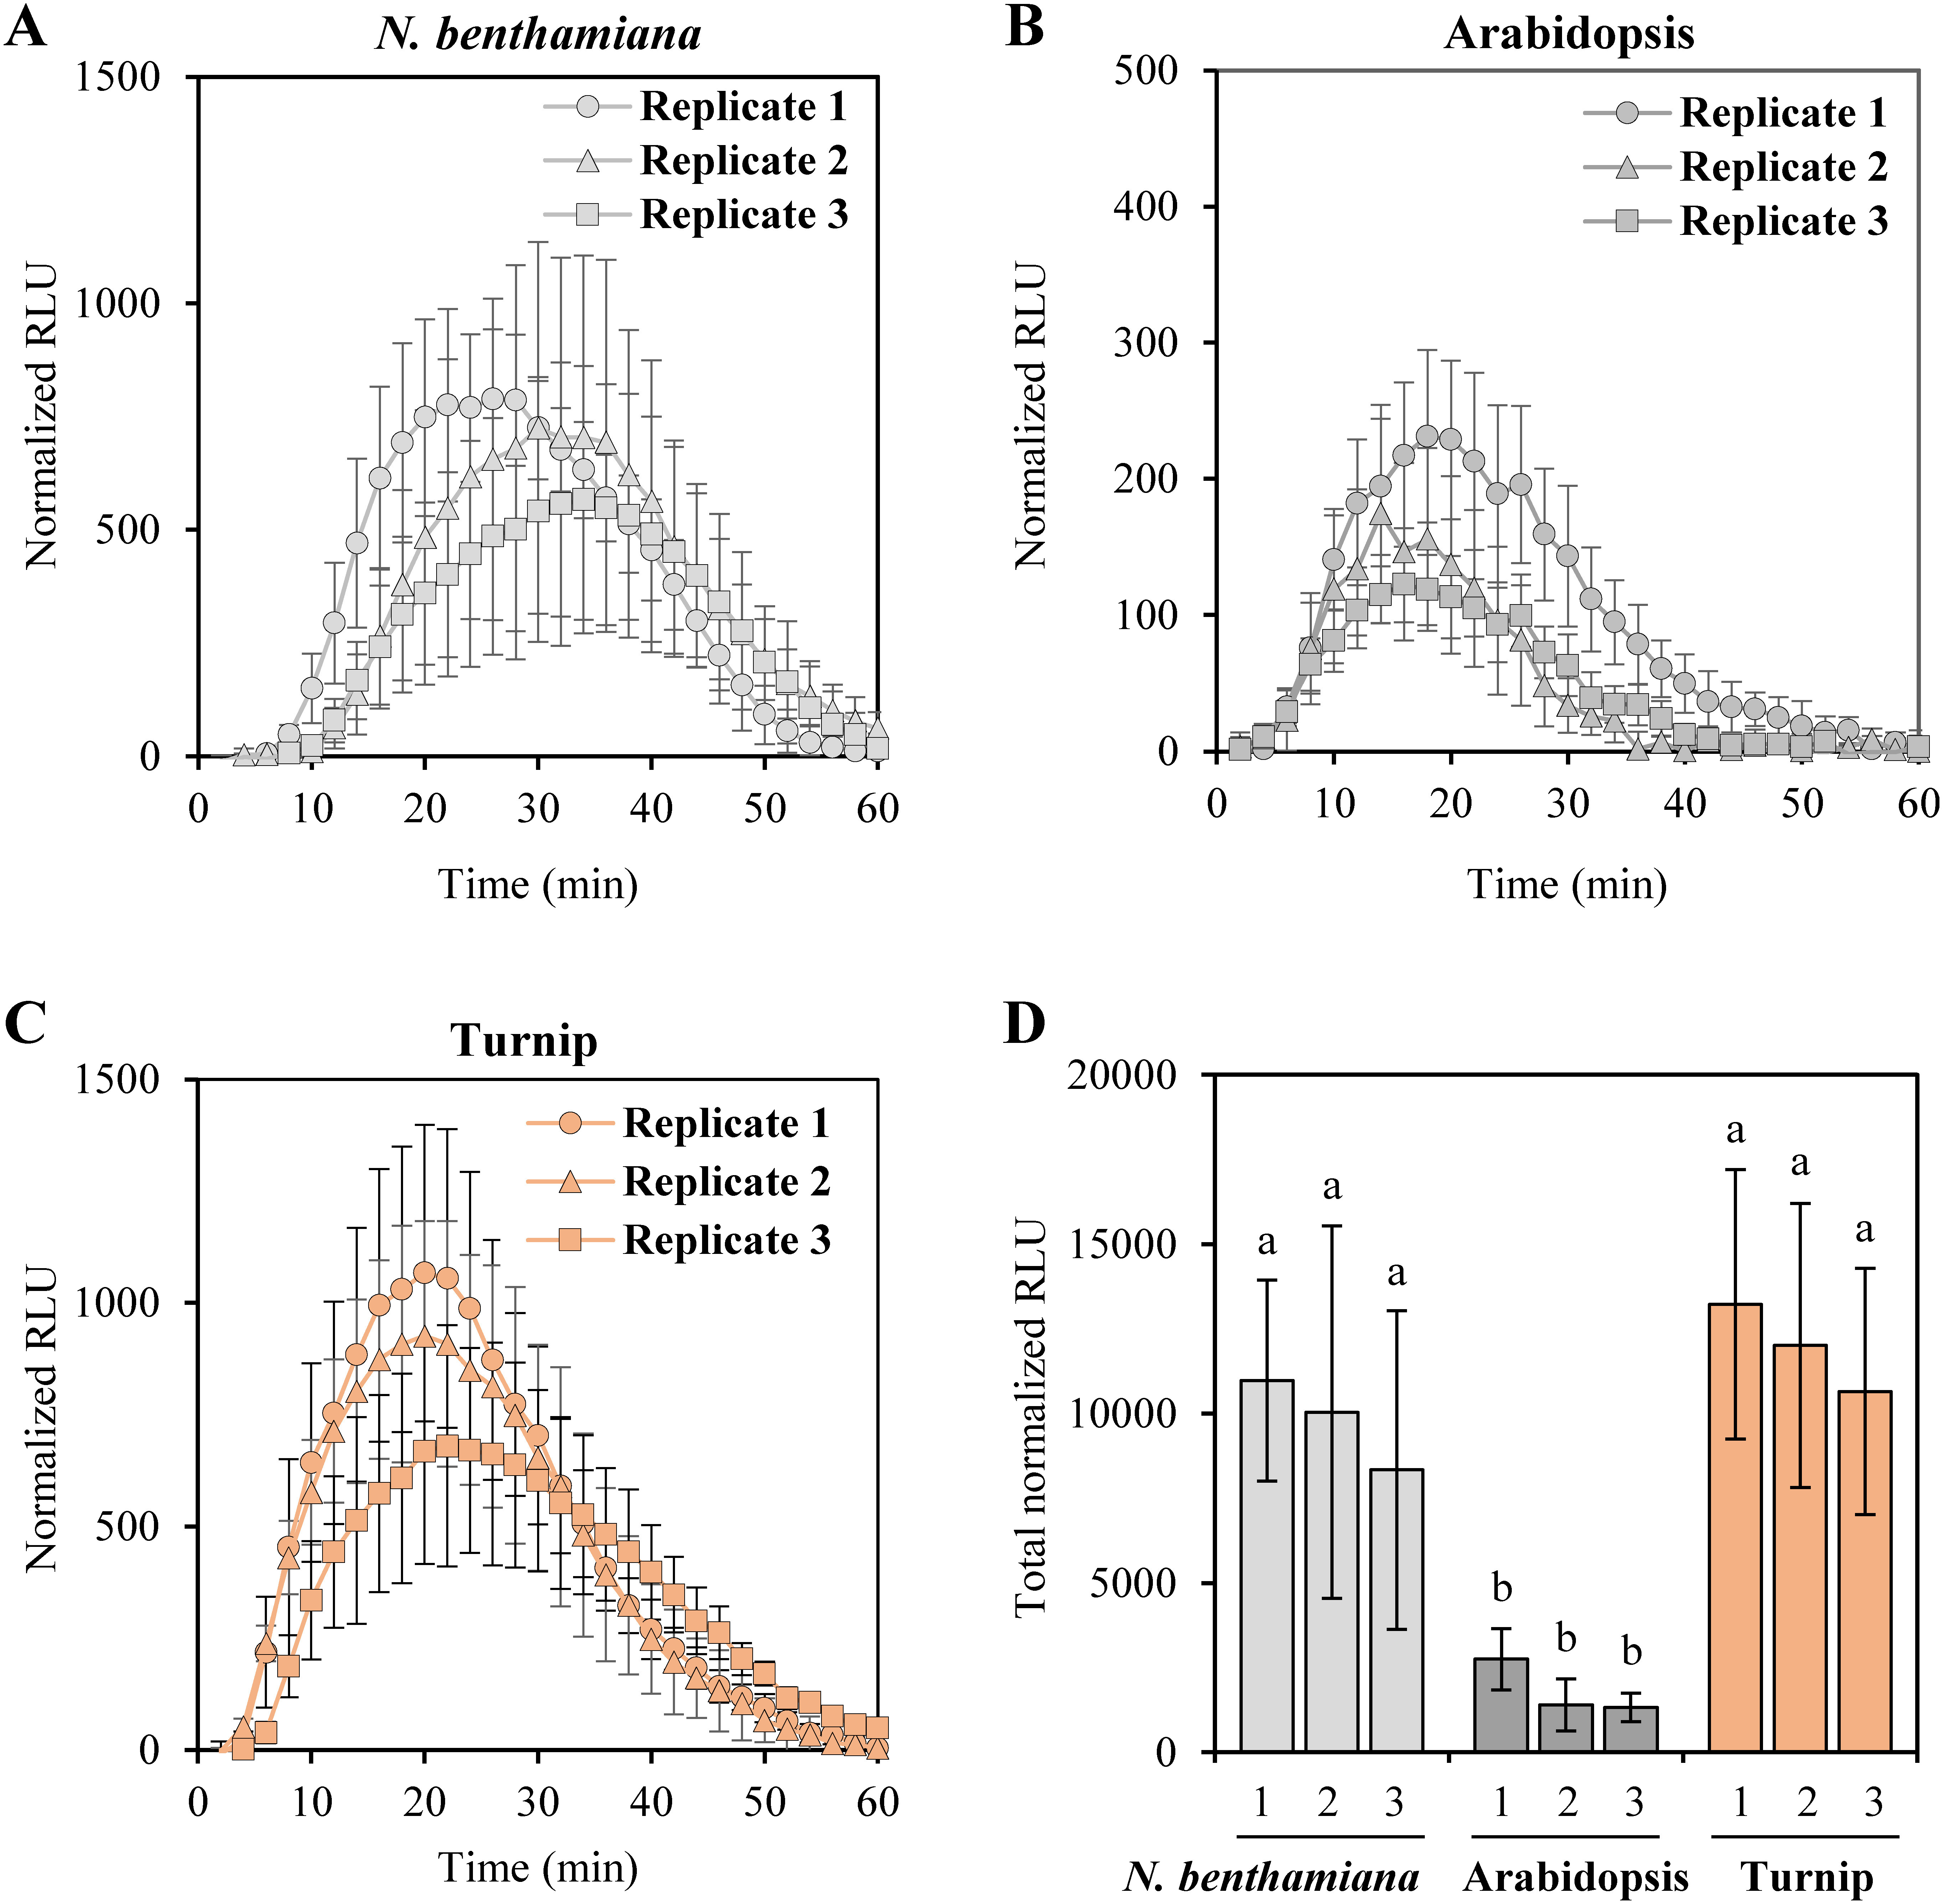
Figure 3. Normalized RLU after removal of background when 100 nM flg22 was treated to N. benthamiana, Arabidopsis, and turnip. (A–C) Normalized RLU for 60 min after 100 nM flg22 treatment in triplicate experiments of N. benthamiana (A), Arabidopsis (B), and turnip (C). For each time point, normalized RLU value was obtained by subtraction of the background RLU value of mock treatment from the RLU value of 100 nM flg22 treatment. Each graph shows three individual tests. (D) Total normalized RLU of the three plant species. Each number under the horizontal axis indicates the replicate number of (A–C). Data are presented as average±SD (n=8, biological replicates). Significance was analyzed by one-way ANOVA and Tukey HSD test. Different letters indicate significant differences (p<0.05).