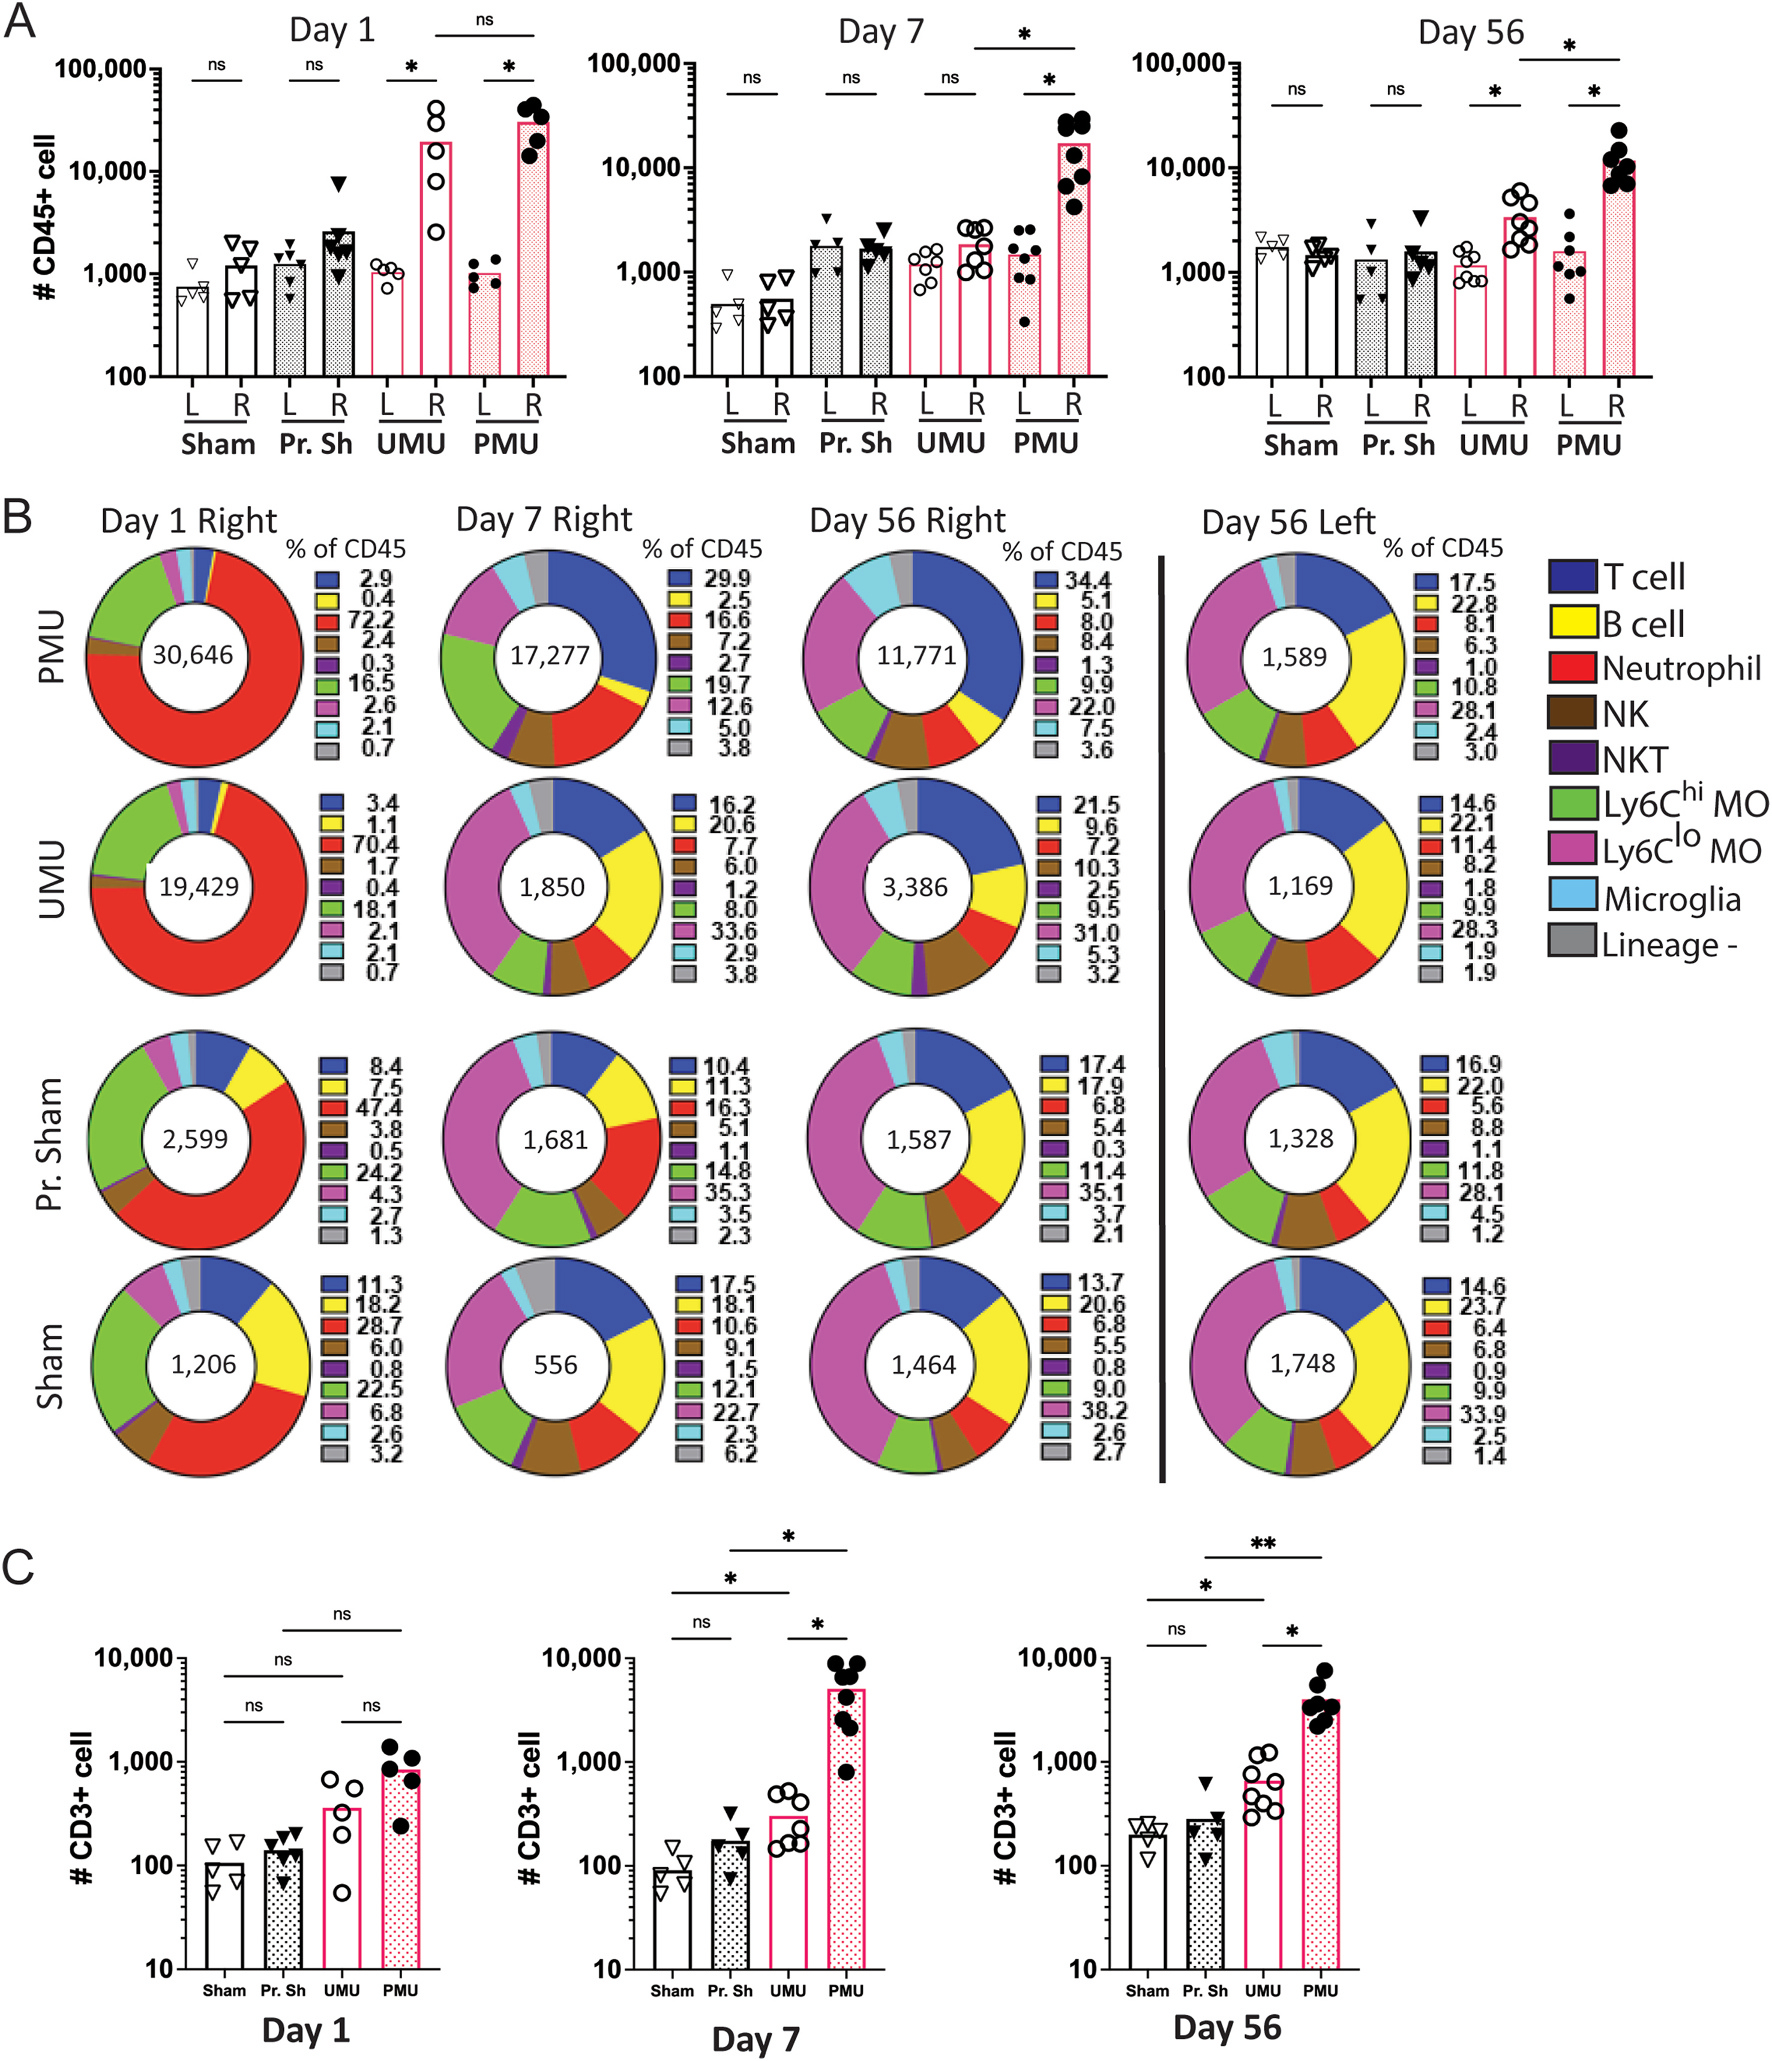
Fig. 2. Priming leads to significantly increased total ocular CD45þ cells and T cells by day 7 after IVT.

(A) Ocular CD45+ cell number for injected right (R) and control left (L) eyes on days 1, 7 and 56 after intravitreal injection. Each point represents the cell count from an individual eye. Sham (Sham), primed sham (Pr. Sh), unprimed Mtb (UMU), primed Mtb (PMU). All comparisons indicated. Significance determined by Brown-Forsythe ANOVA with Dunnett’s T3 multiple comparison test. (B) Pie charts show the distribution of inflammatory cell types present as the percentage of CD45+ cells. Average number of CD45+ shown in the center of the pie chart. Neutrophils are the dominant population on day 1. T cells (dark blue) become the major cell population in PMU eyes on day 7. In contrast CD11bhi, Ly6Clo monocytes (pink) become the major population in UMU eyes. (C) Total number of ocular T cells on days 1, 7 and 56. PMU eyes have significantly more T cells than UMU eyes on days 7 and 56. Unpaired t-test with Welch’s correction. ns = not significant, *p < 0.05. NK = natural killer cell, NKT = natural killer T cell, Ly6Chi MΦ (macrophages), Ly6Clo MΦ (macrophages). (For interpretation of the references to color in this figure legend, the reader is referred to the Web version of this article.)
