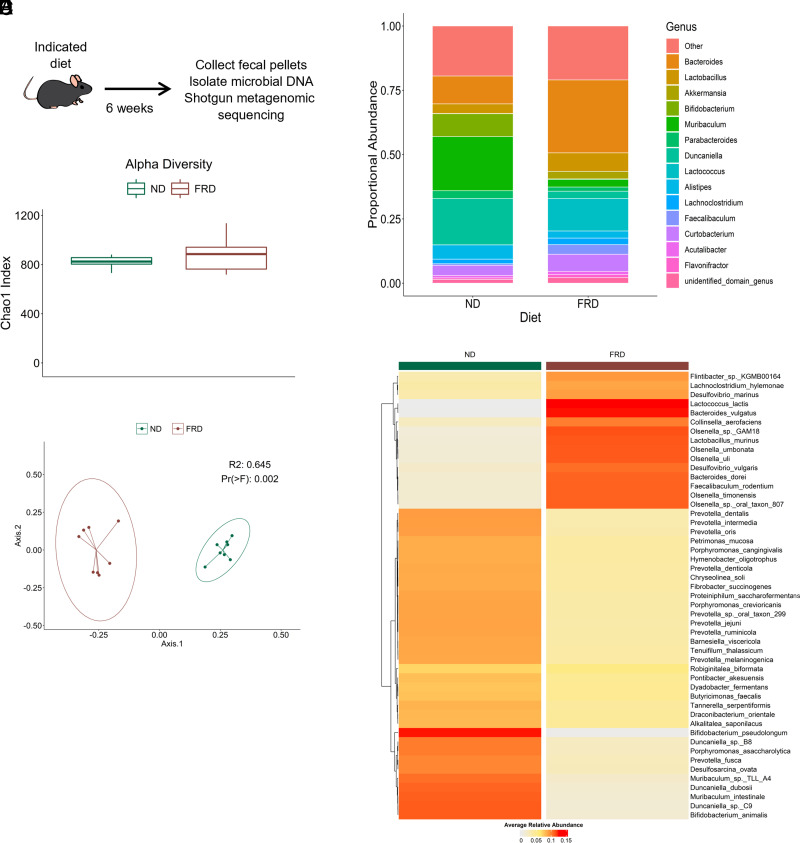
FIGURE 1.
An FRD can modulate the composition of the gut microbiome.
Four- to 6-wk-old B6 mice were fed an FRD or ND for 6 wk before fecal pellets were collected, microbial DNA was isolated, and shotgun metagenomic analysis was performed. (A) Schematic of the experimental procedure. (B) Chao1 α diversity of the mice in each group. (C) Bray–Curtis dissimilarity measure of β diversity within each diet group displayed using a principal coordinate analysis plot. Each dot represents a single mouse. (D) Stacked bar plots visualizing alterations in relative abundance of the top 20 bacterial genera in each diet group. Genera depicted represent 79.9% of bacterial genera in each group. (E) Heatmap depicting the relative abundance of bacterial species at α = 0.01 in both dietary groups. Each column represents a single mouse. n = 8 per group, two cages per diet. Values are representative of one independent experiment.

