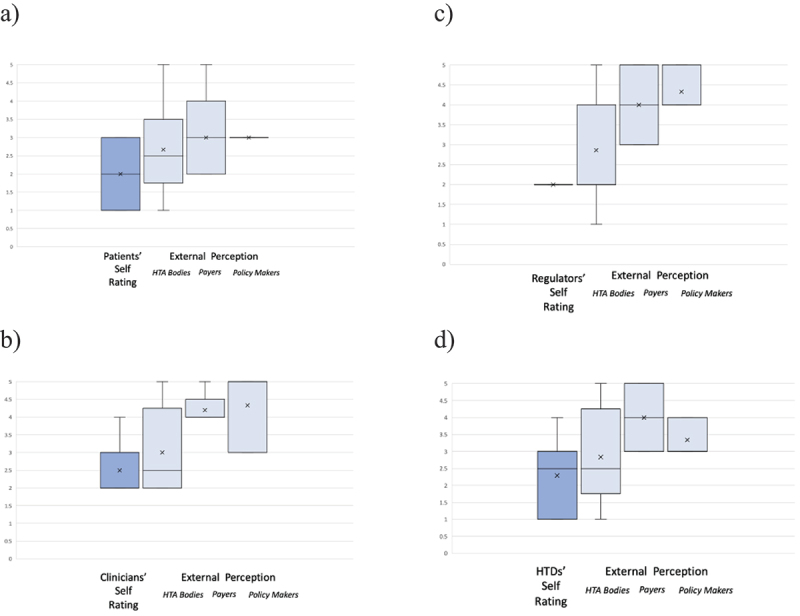
Figure 4.

a-d: Box Plots (Mean [x]; Medium; Max; Min; Upper and Lower Quartile) of stakeholder involvement self-rating versus external perception of respective stakeholder/collaborator involvement as rated by HTA bodies; payers; and health policy makers. Scale ranging from 1 to 5, per stakeholder group (a: patients’ representatives; b: clinicians’ representatives; c: regulatory representatives; d: HTD representatives).
