Figure 1.

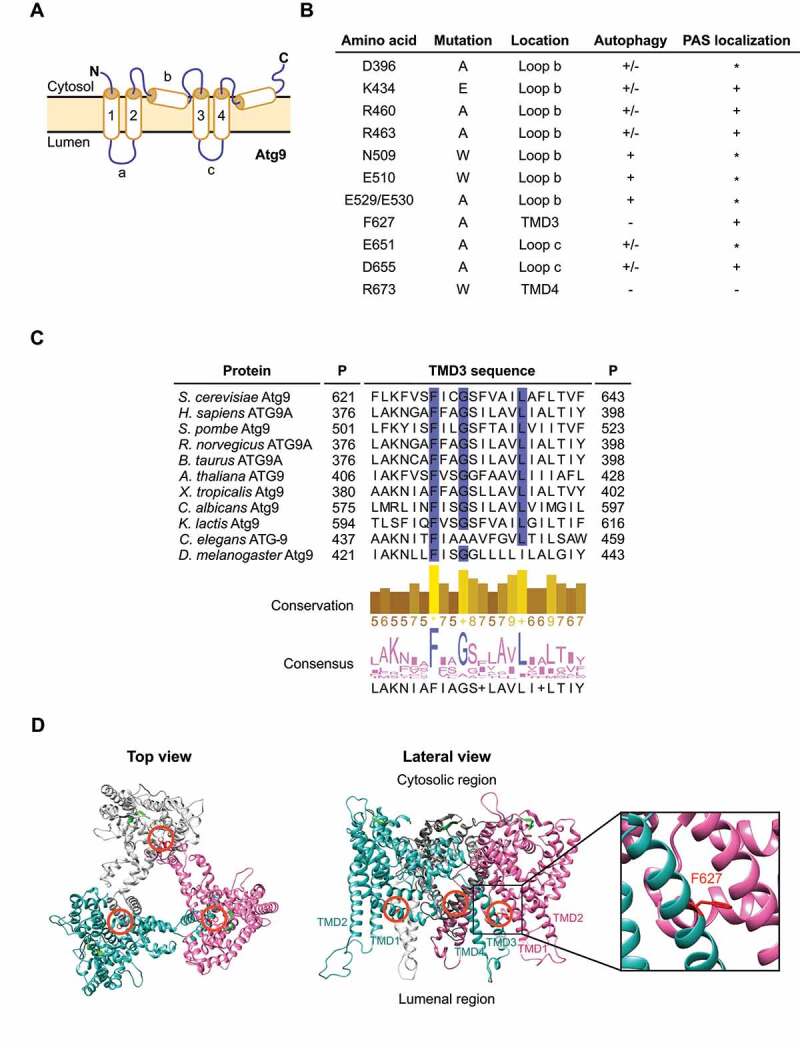
Screen for identification of Atg9 mutants. (A) Schematic representation of the S. cerevisiae Atg9 topology. As recently described, Atg9 presents 4 transmembrane domains (TMDs) (1 to 4) connected by 3 loops (a to c), two luminal and one cytosolic. The N and C termini possess one membrane helix which enter and exit through the cytosolic side of the membrane. (B) Overview of the Atg9 mutations generated in this study. Their position in the amino acid sequence and location within Atg9, i.e., the TMD or loop, are indicated based to the schematic representation in panel A. The effect of mutations on the autophagic flux and Atg9 localization to the PAS are detailed. The asterisk (*) highlights those mutants that although not easily detected at the PAS, did not display an autophagy defect. (C) Alignment of the amino acid sequences in the region that includes the TMD3 of Atg9 from different organisms. P, position of the first and last showed residues. The conservation and the consensus for each position are indicated and visualized as histograms. The conservation of physical-chemical properties is scored from 0 to 11. The highest score, i.e. 11, are highlighted with an asterisk while scores 10, which indicate conservation of properties but not conservation in the residue identity, are marked with a plus. Highly conserved residues are also highlighted in blue. (D) Homotrimeric Atg9 structure from S. cerevisiae was modelled using the structures of SpAtg9 as the template. The top view from the cytoplasmic side (left panel) and the lateral view from the side of the membrane (right panel) are shown. Colored chains (white, blue and magenta) correspond to each Atg9 monomer. Orange circles indicate the location of the F627 residue of each monomer, which is also colored in red. The β-sheet colored in green correspond to the 766–770 motif located in the cytosolic C-terminal domain. The lateral view and the inset show the position of F627 in the TMD3, at the interface between the monomers.
