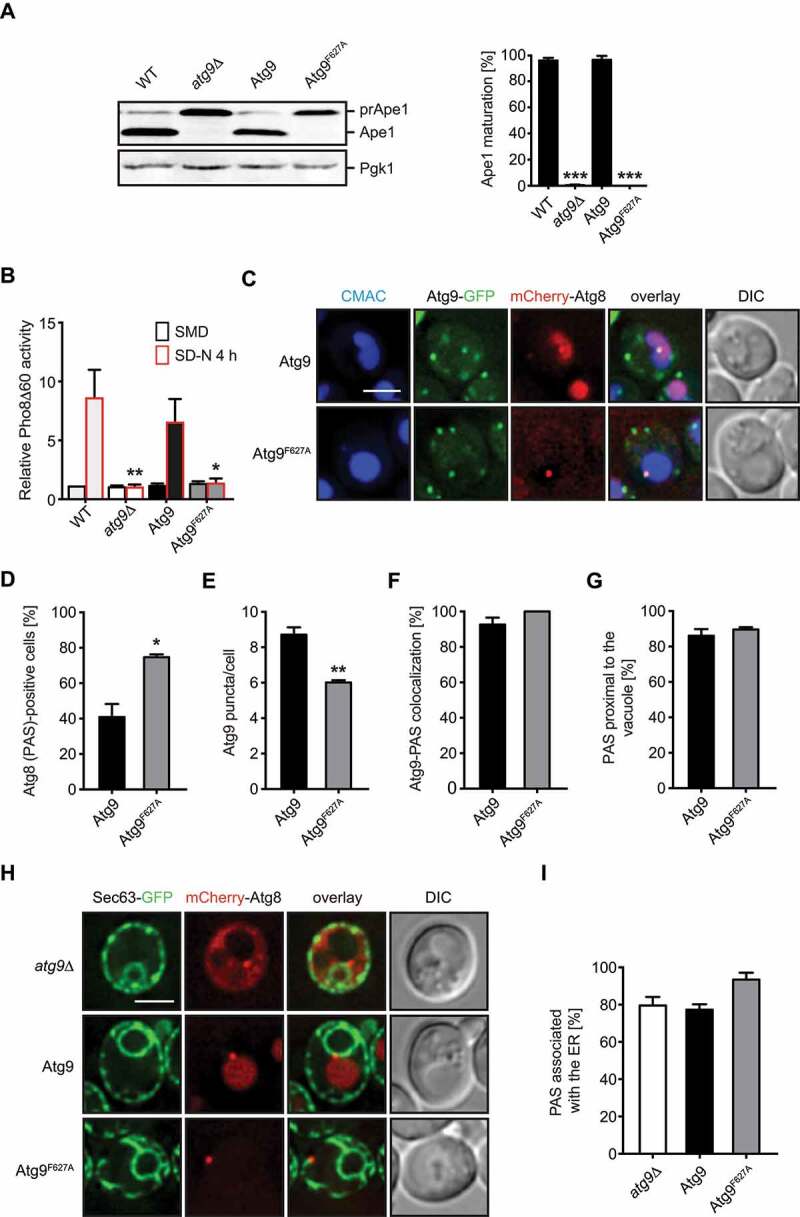
Figure 2.

The Cvt pathway and bulk autophagy are blocked in cells expressing Atg9F627A, although its recruitment to the PAS and the PAS positioning are not affected. (A) WT (SEY6210), atg9∆ (RGY751) and atg9∆ cells carrying an integrative plasmid expressing either Atg9-GFP (RGY871, Atg9) or Atg9F627A-GFP (RGY874, Atg9F627A) were grown to a log phase in YPD medium before being nitrogen starved for 4 h in SD-N medium. Proteins were precipitated with 10% trichloroacetic acid and analyzed by western blot using anti-Ape1 and anti-Pgk1 antibodies. Pgk1 served as the loading control. The percentage of prApe1 maturation was quantified and asterisks indicate significant differences with the WT cells. (B) WT (YTS159), atg9∆ (FRY244) and atg9∆ cells expressing either tagged Atg9-GFP (RGY883, Atg9) or AtgF627A-GFP (RGY872, Atg9F627A) were grown to a log phase in YPD or nitrogen starved in SD-N medium for 4 h before measuring Pho8∆60 activity in cell lysates. Pho8∆60 activity was expressed relative to the WT control in YPD medium. Asterisks indicate significant differences with then nitrogen-starved atg9∆ strain carrying WT Atg9. (C) Subcellular distribution of Atg9. The atg9∆ strain expressing mCherry-Atg8, a PAS marker protein, and either Atg9-GFP (RGY745) or Atg9F627A-GFP (RGY884), was grown to an early log phase in YPD medium, nitrogen-starved in SD-N medium for 1 h and labelled with CMAC, a dye specifically staining the vacuole, before being imaged. DIC, differential interference contrast. Scale bar: 2 μm. (D) Quantification of the percentage of cells in panel C with mCherry-Atg8-positive PAS. Asterisks highlight significant differences with cells expressing WT Atg9. (E) Quantification of Atg9-GFP puncta per cell in the experiment shown in panel C. Asterisks indicate significant differences with cells carrying WT Atg9. (F) Statistical evaluation of the percentage with mCherry-Atg8-positive PAS also positive for Atg9-GFP in the experiment depicted in panel A. (G) Quantification of the percentage of mCherry-Atg8-positive PAS in close proximity of the vacuole in panel C. (H) The atg9∆ strain co-expressing endogenous Sec63-GFP, an ER marker protein, and mCherry-Atg8, and carrying an empty vector (RGY760, atg9∆) or an integration plasmid expressing Atg9-13xMYC (RGY762, Atg9) or Atg9F627A-13xMYC (RGY876, Atg9F627A), were imaged as in Figure 2C. DIC, differential interference contrast. Scale bar: 2 μm. (I) Statistical evaluation of the percentage of mCherry-Atg8-positive PAS associated with the ER in the experiment shown in panel A.
