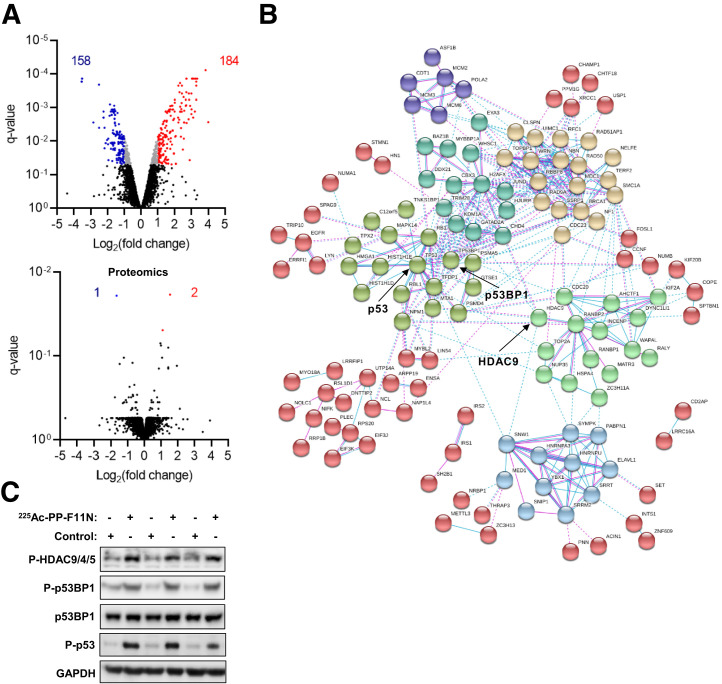
FIGURE 1.
Cellular responses to TAT with 225Ac-PP-F11N. (A) A431/CCKBR cells were treated with 255Ac-PP-F11N, and the generated tryptic peptides and phosphopeptide-enriched samples were subjected to proteomics and phosphoproteomics analysis, respectively. Volcano plots display phosphopeptide (phosphoproteomics) and protein (proteomics) abundance shown as log2-transformed fold change. Red and blue dots indicate significantly altered abundance of phosphopeptides or proteins. Q-value < 0.05. (B) Interaction networks of proteins with altered phosphorylation or expression in response to 225Ac-PP-F11N treatment. (C) Western blot analysis for phosphorylation of HDAC9, HDAC4, and HDAC5 at S246, S259, and S220, respectively; p53BP1 at S1778; p53 at S15; and total p53BP1 and GAPDH in protein lysates isolated from 225Ac-PP-F11N–treated and untreated (control) cells.

