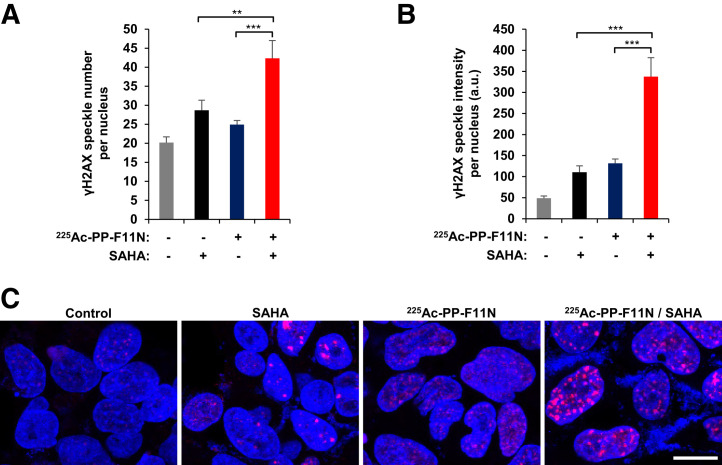
FIGURE 3.
HDAC inhibition by SAHA increased level of γH2AX in 225Ac-PP-F11N–treated cells. A431/CCKBR cells were treated with 3 kBq/mL dose of 225Ac-PP-F11N or 2 μM SAHA alone or in combination for 24 h. (A and B) Bars represent mean ± SEM of numbers and intensities of γH2AX-positive speckles per nucleus. (C) Typical images of treated and control cells. Red = γH2AX; blue = Hoechst 33258; scale bar = 20 μm; a.u. = arbitrary units. **P < 0.01. ***P < 0.001.

