FIGURE 4.
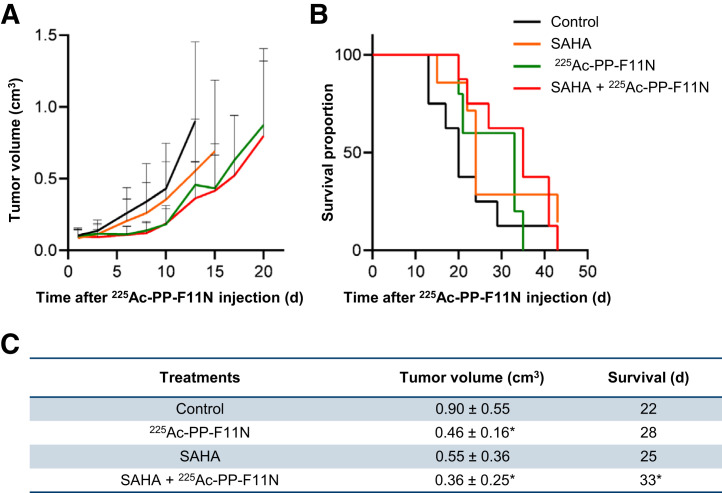
Tumor growth inhibition and prolonged survival in SAHA and 225Ac-PP-F11N–treated mice. (A) Tumor growth curves in A431/CCKBR xenografted mice after administration of 225Ac-PP-F11N or phosphate-buffered saline (control) alone or in combination with SAHA. Values represent mean ± SD. (B) Survival proportion presented as Kaplan–Meier curves of control and different treatment groups. (C) Mean tumor volume ± SD on day 13 and survival in control and different treatment groups. *P < 0.05.

