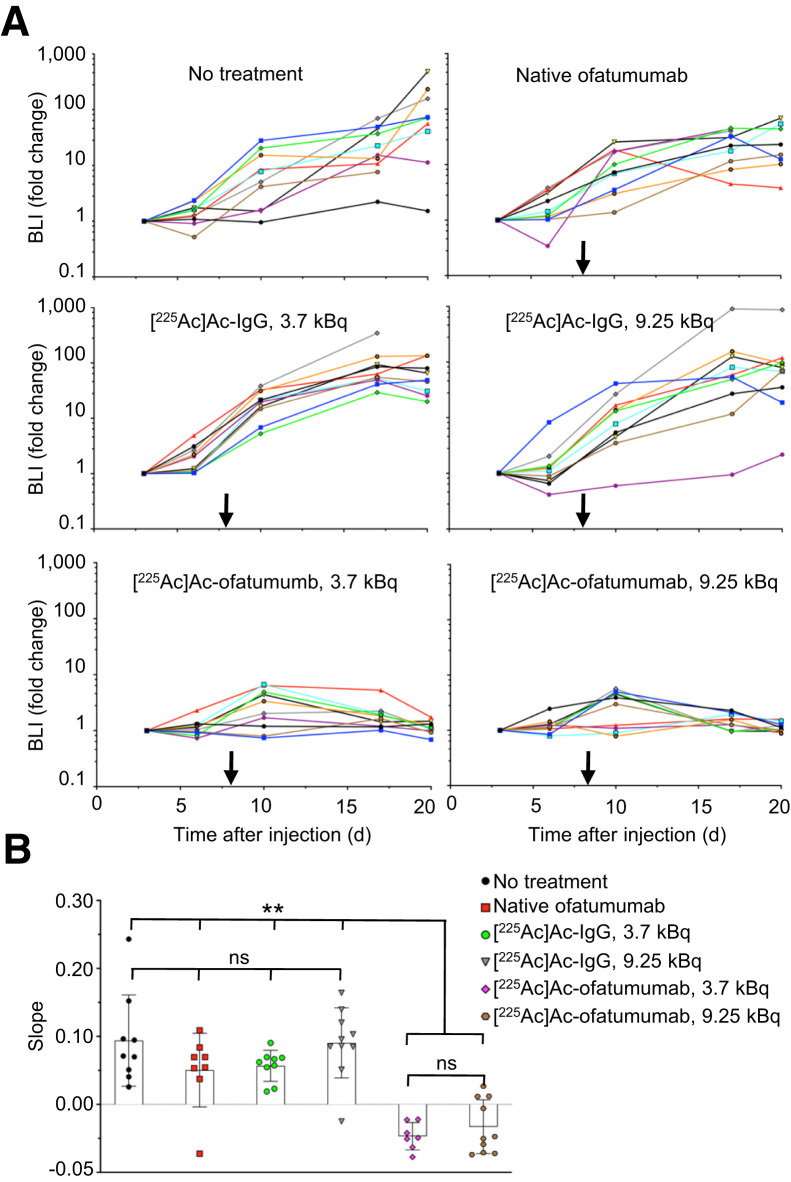
FIGURE 4.
Rapidity of therapeutic effects in mice treated 8 d after cell injection. (A) Bioluminescence of mice 3–20 d after cell injection, showing profound reduction of cancer cell growth rates by [225Ac]Ac-ofatumumab. (B) Comparison by ANOVA of bioluminescence from 2 to 10 d after therapy initiation (10–20 d after cell injection). n = 7–10/cohort. BLI = bioluminescence; ns = not statistically significant. **P < 0.005.

