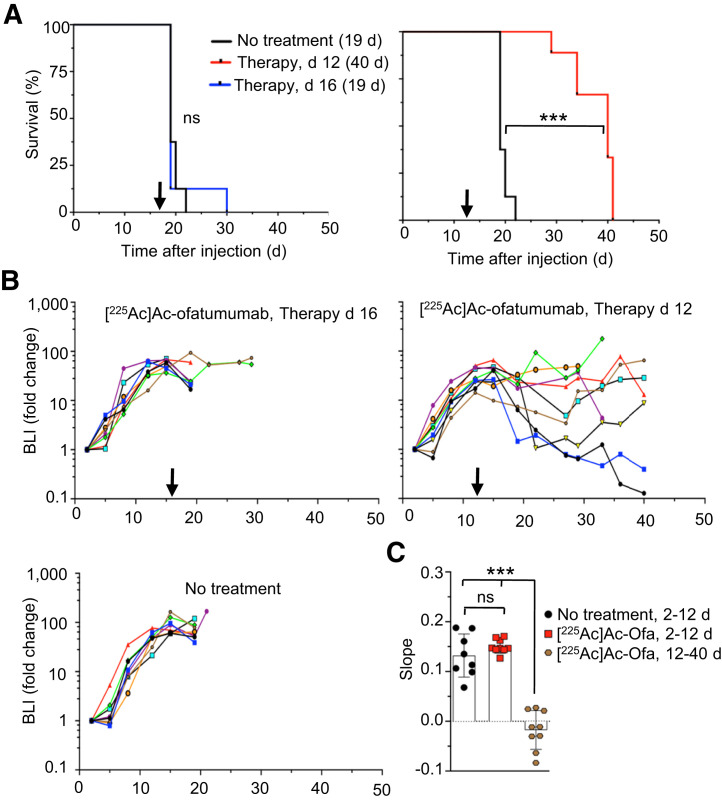
FIGURE 5.
Survival and bioluminescence of mice with larger pretreatment cancer-cell burden. (A) Kaplan–Meier graph of untreated mice vs. treatment started 16 d (left) or 12 d (right) after cell injection, with median survival indicated. Significance was evaluated by Mantel–Cox test. (B) Bioluminescence, showing effect on cancer-cell numbers for cohort treated on day 12 but not day 16. (C) ANOVA comparison of cancer-cell growth of untreated mice or mice treated 12 d after cell injection. n = 7–9/cohort. BLI = bioluminescence; ns = not statistically significant. ***P < 0.0001.

