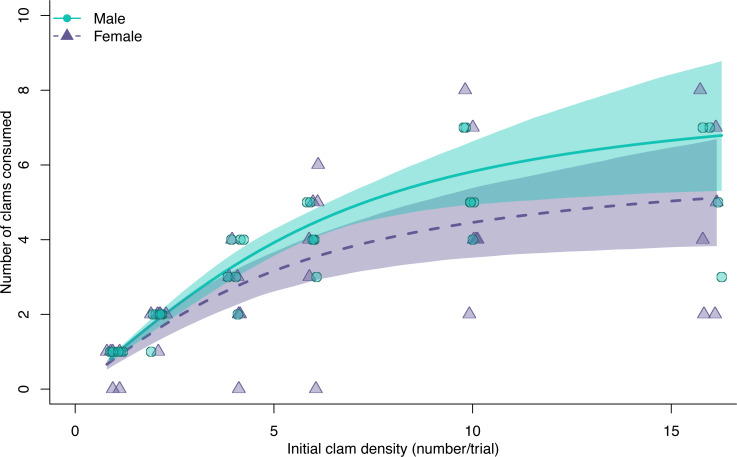
Figure 1. Functional response curves for male (blue dots, solid line) and female (purple triangles, dashed line) European green crabs (Carcinus maenas), relating the mean number of varnish clams consumed to varnish clam (Nuttallia obscurata) density.
Both curves are a Type II response. The shaded areas are 95% bootstrapped confidence intervals.

