FIGURE 2.
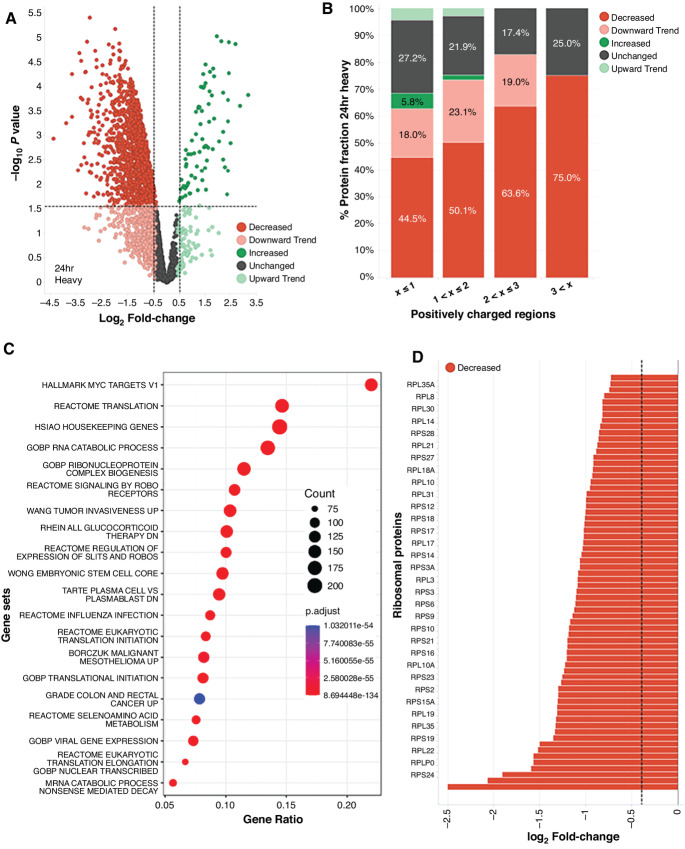
ZKN-157 selectively inhibits new protein synthesis in a sensitive colorectal cancer cell line. A, Volcano plot showing heavy-isotope intensities (newly synthesized protein abundance) for 2867 proteins detected at 24-hour timepoint. Protein were classified as follows: Decreased (log2FC < −0.4, Padjusted < 0.05, red), Downward Trend (log2FC < −0.4, Padjusted > 0.05, pink), Increased (log2FC > 0.4, Padjusted < 0.05, dark green), Upward Trend (log2FC > 0.4, Padjusted > 0.05, light green), Unchanged (−0.4 < log2FC < 0.4, Padjusted > 0.05, dark gray). Dotted lines indicate −0.5 and 0.5 log2FC values. B, Bar graph plotting percent protein fraction of heavy-isotope intensity (categorized as in A) at 24-hour timepoint versus positively charged regions. Positive charge windows were generated by assigning K and R residues a positive 1 charge and all other amino acid residues a charge of 0. Average charge values were then calculated along a 10-amino acid long sliding window for each protein's amino acid sequence (starting at the first residue and ending at the last complete set of 10 residues). C, Overrepresentation analysis and pathway enrichment in significantly downregulated proteins from A are shown. Count refers to the number of genes found in each pathway while gene ratio refers to the count divided by all genes in the pathway. D, Bar graph showing nascent protein abundance for 68 Ribosomal proteins from heavy-isotope intensity analysis at 24-hour timepoint (categorized as in A). The dotted line indicates −0.4 log2FC value.

