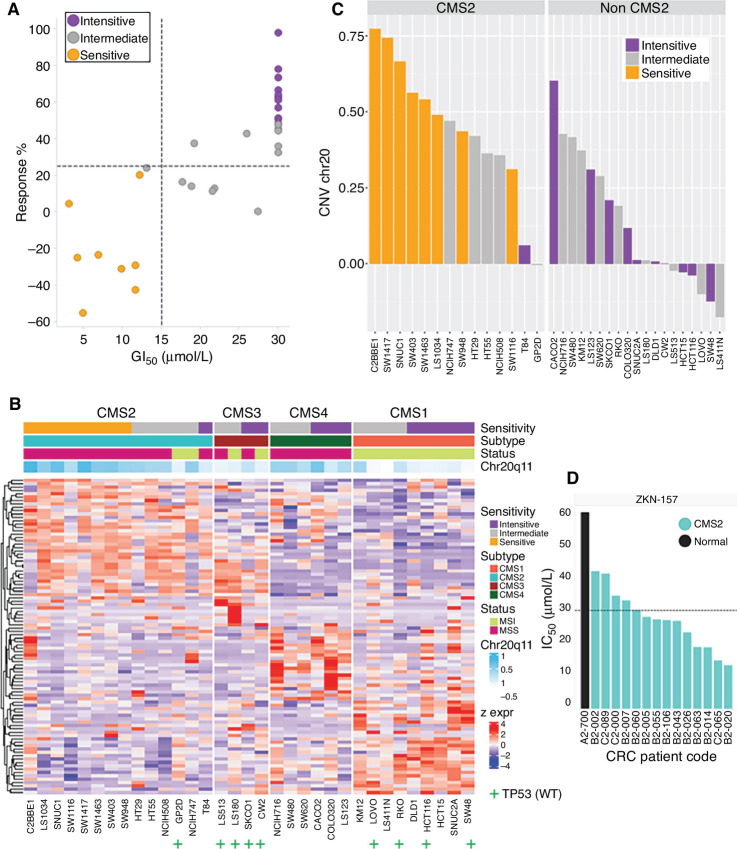
FIGURE 4.
Sensitivity to ZKN-157 enriched in CMS2 subtype and is associated with a distinct molecular signature. A, Scatter plot displaying drug sensitivity metrics for ZKN-157 across 33 colorectal cancer cell lines with colors indicating sensitive, intermediate, and insensitive cell lines. Dotted lines indicate response percent (%) = 25 μmol/L (horizontal) and GI50 = 15 μmol/L (vertical). B, Heat map of gene expression data for CMS subtype genes across colorectal cancer cell lines shows an enrichment of sensitive cell lines in the CMS2 subtype. Row annotations show drug sensitivity, MSI/MSS status, CMS subtypes and average CNV ratios for Chr20q11–13. “+” used to annotate cell lines with WT TP53, unannotated cell lines harbor mutations in TP53. C, Bar graph plotting Chr20 CNV ratios for colorectal cancer cell lines, split by CMS2 subtype shows a further enrichment of sensitive cell lines in the CMS2 subtype with Chr20q11-13 CNV gain. D, Bar graph plotting IC50 values for ZKN-157 across colorectal cancer–derived CMS2 (light blue bars) and normal (black bar) organoids. Dotted line indicates IC50 = 30 μmol/L.

