FIGURE 5.
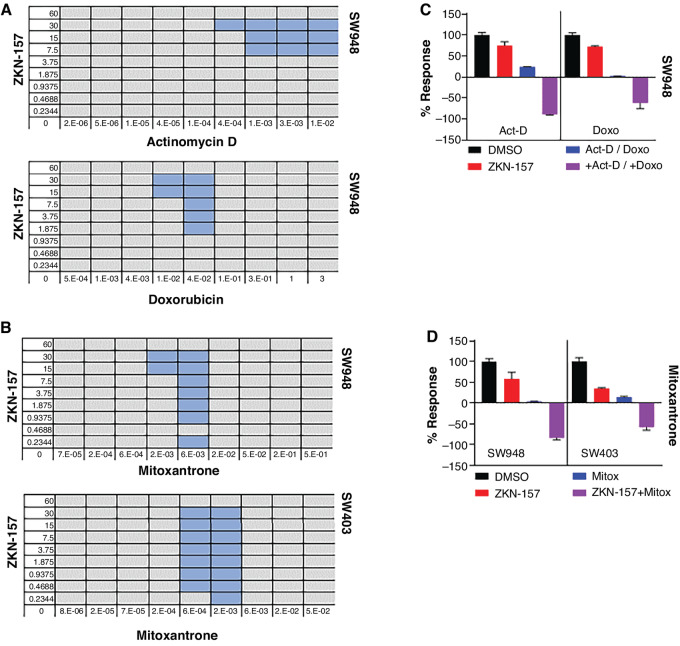
ZKN-157 demonstrates synergy with DNA-intercalating agents in CMS2 cell lines. A, Matrices showing BI scores for combinations of ZKN-157 with actinomycin D and doxorubicin on SW948 cells. Dose combinations demonstrating synergy are highlighted in blue. B, Matrices showing BI scores for combinations of ZKN-157 with mitoxantrone on two cell lines: SW948 and SW403. Single-agent concentrations (in μmol/L) in all first columns and bottom rows for all matrices. C, Percent response bar graph showing ZKN-157′s efficacy enhanced in combination with actinomycin D (Act-D) and doxorubicin (Doxo) in SW948 cells. Bars are color coded as follows: DMSO (black), ZKN-157 (30 μmol/L, red), Act-D (10 nmol/L, blue), Doxo (330 nmol/L, blue), ZKN-157+Act-D and ZKN-157+Doxo (purple). D, Percent response bar graph showing ZKN-157’s efficacy enhanced in combination with mitoxantrone (Mitox) in SW948 and SW403 cells. Bars are color coded as follows: DMSO (black), ZKN-157 (30 μmol/L, red), Mitox (6 nmol/L, blue; SW948), Mitox (5.56 nmol/L, blue; SW403), and ZKN-157+Mitox (purple).

