
Fig. 14.
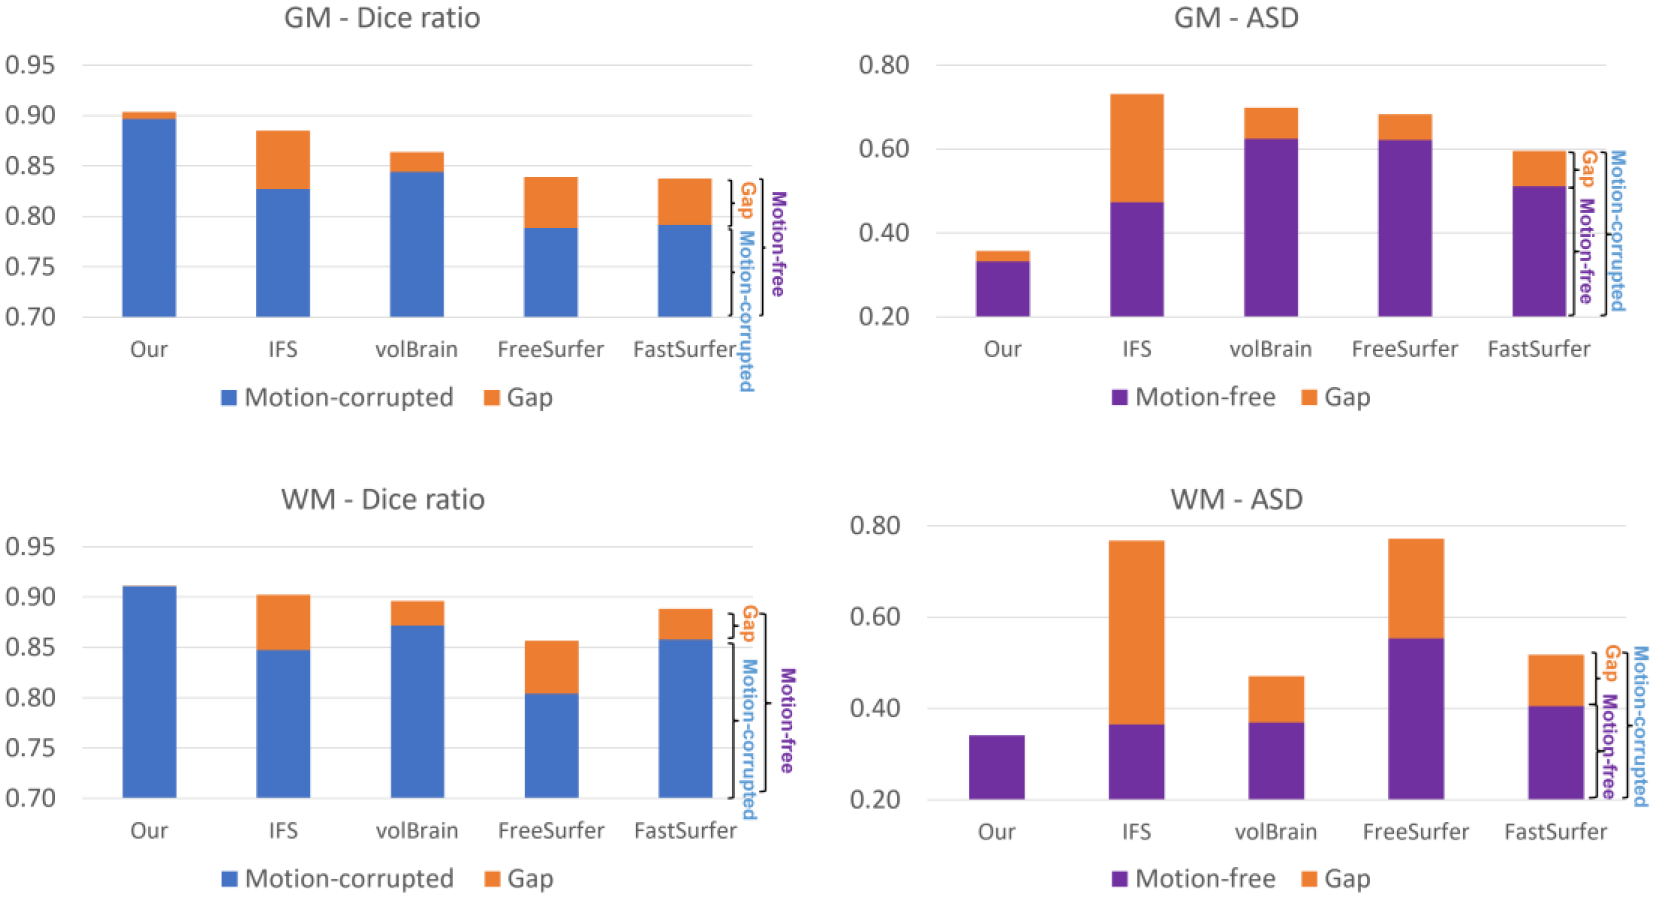
Quantitative comparison of different methods on motion-free and motion-corrupted images. For the Dice ratio metric, the value from motion-corrupted images is presented in blue and the performance gap between motion-free and motion-corrupted images is shown in orange; For the ASD metric, the value from motion-free images is presented in purple and the performance gap is shown in orange. Herein, the Dice ratio and the ASD are computed by considering the manual label as a reference.