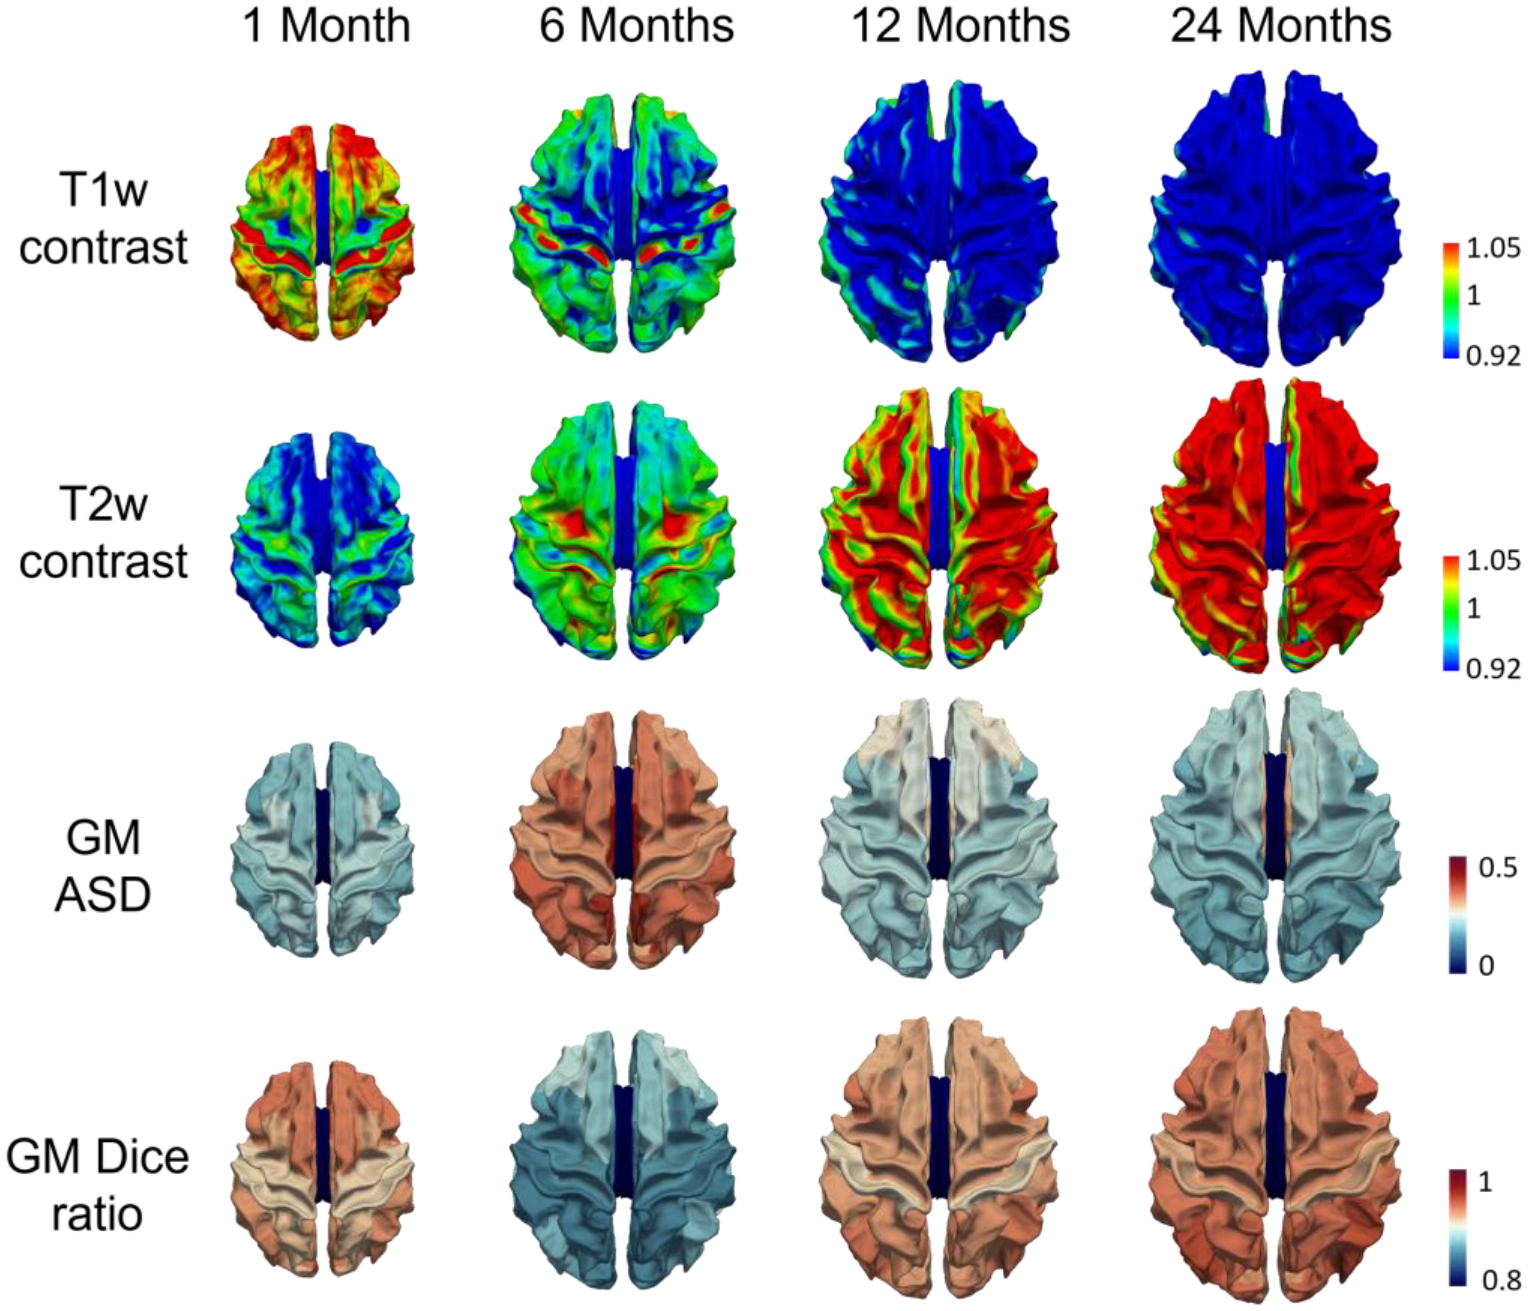
Fig. 18.

The tissue contrasts (values closing to 1 indicating low contrast) of different age groups on T1w (the first row) and T2w (the second row) images and the quantitative comparison of segmentation performance at different cortical regions (the third and fourth rows).
