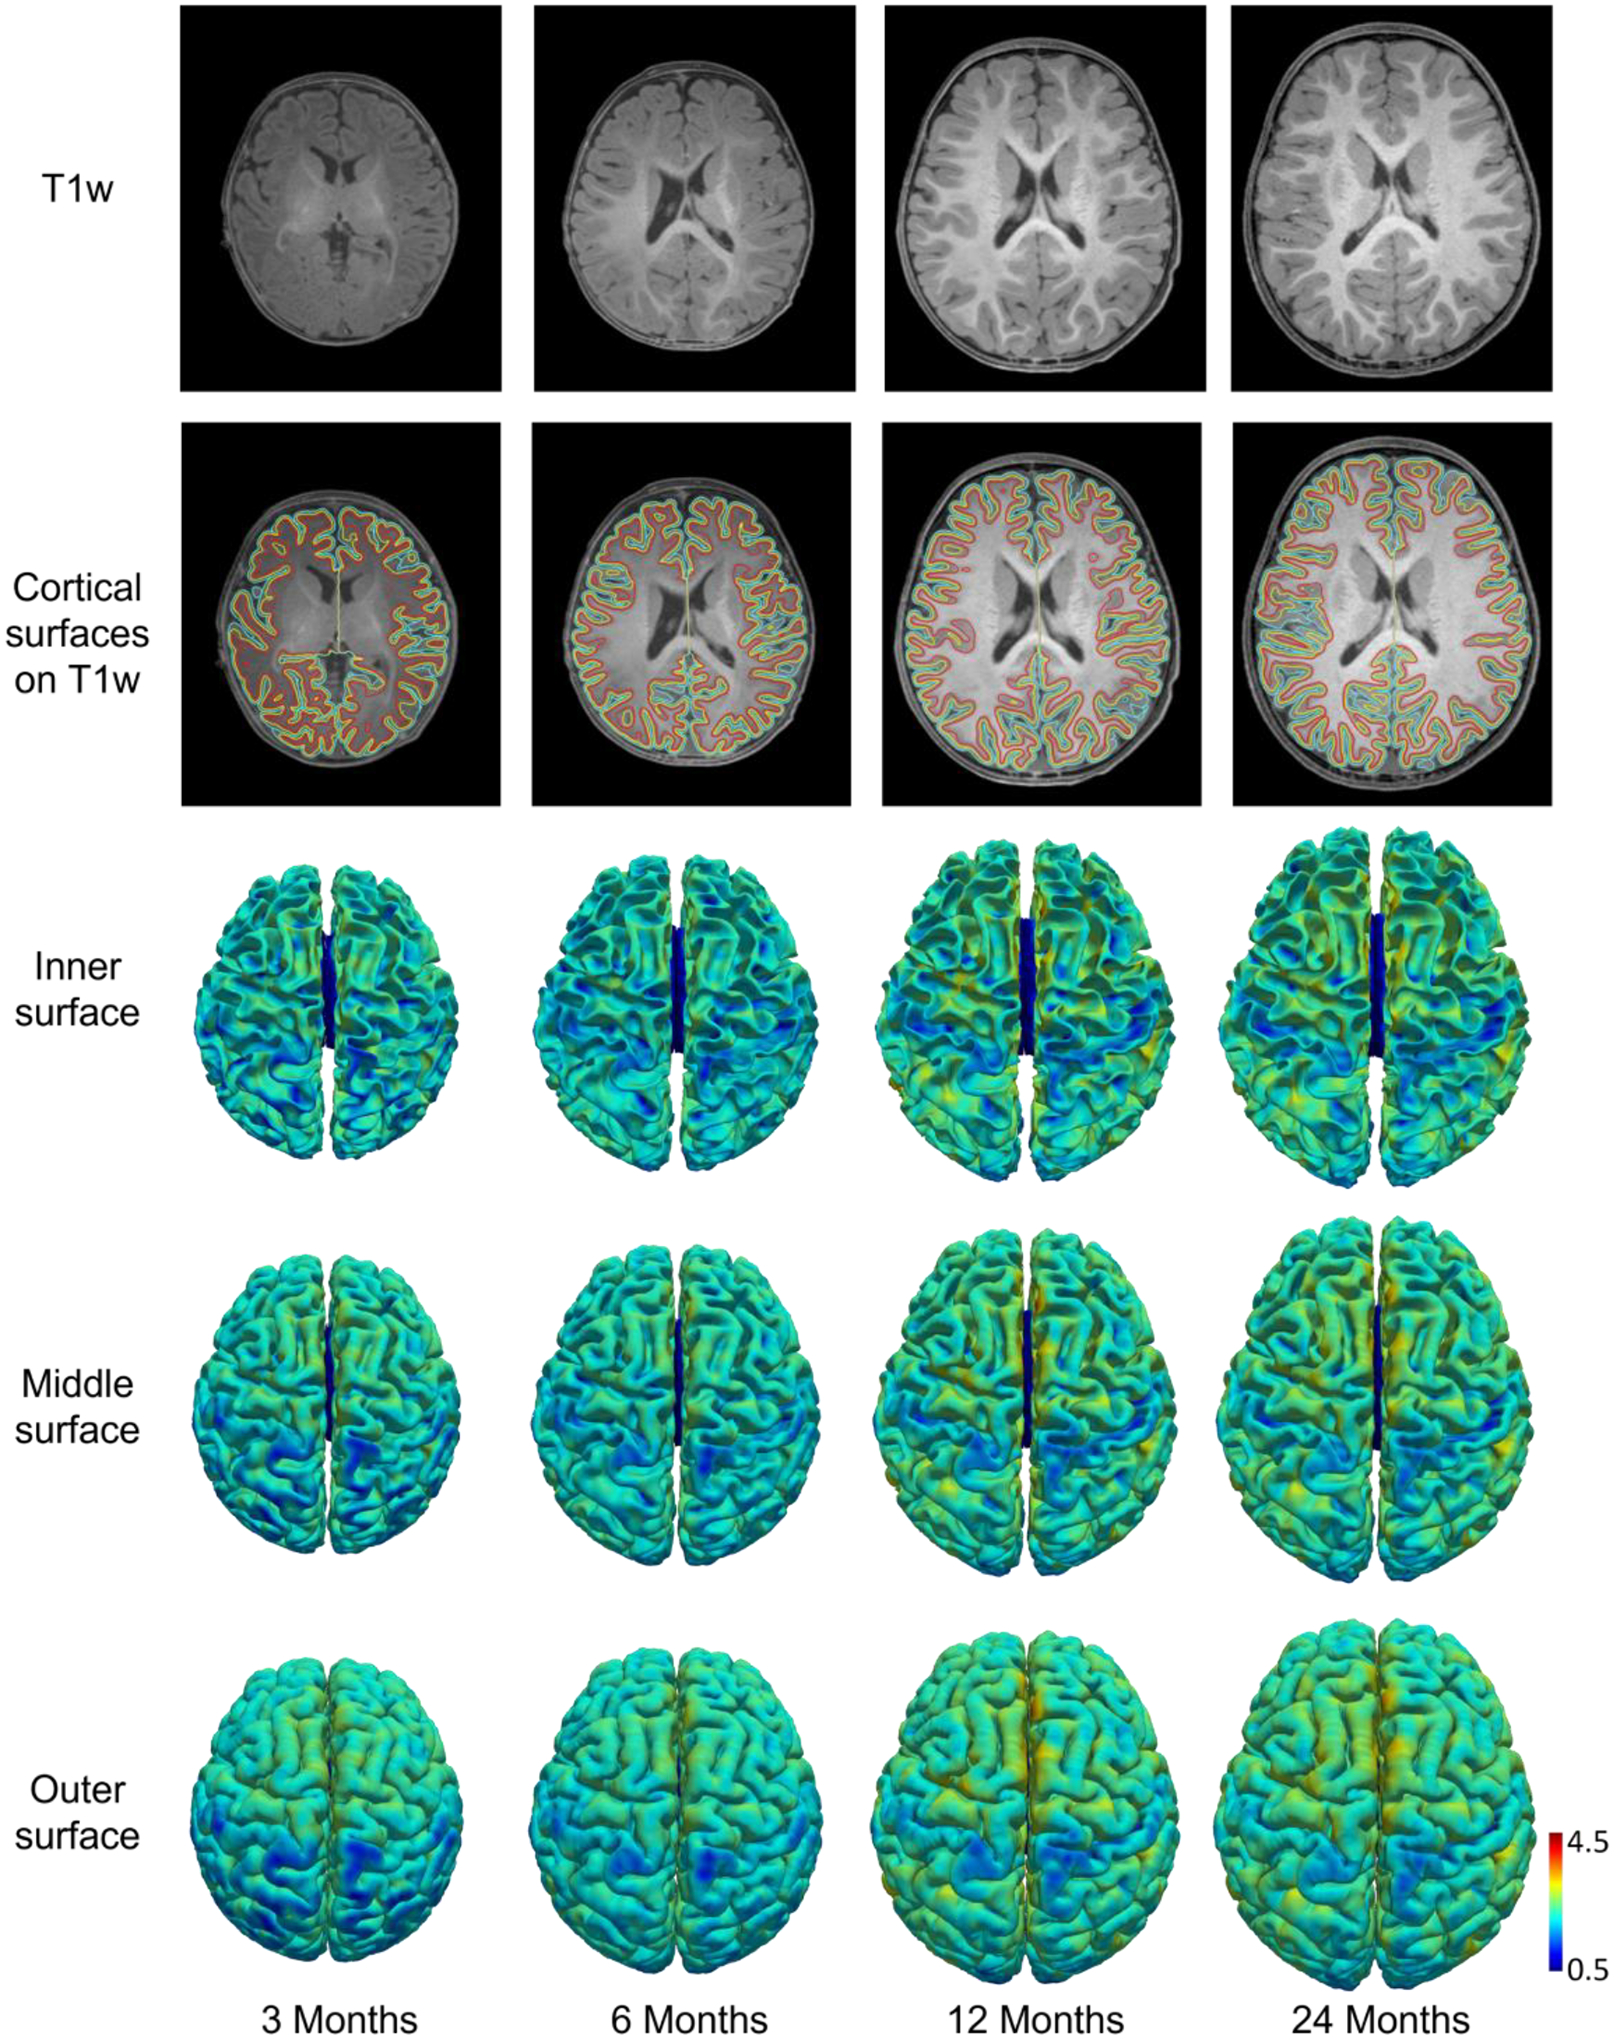
Fig. 4.

T1w images, reconstructed inner, middle, and outer cortical surfaces (color-coded by cortical thickness in mm) from a subject at different ages. Red, yellow, and cyan contours indicate inner, middle, and outer cortical surfaces, respectively, overlaid on T1w images.
