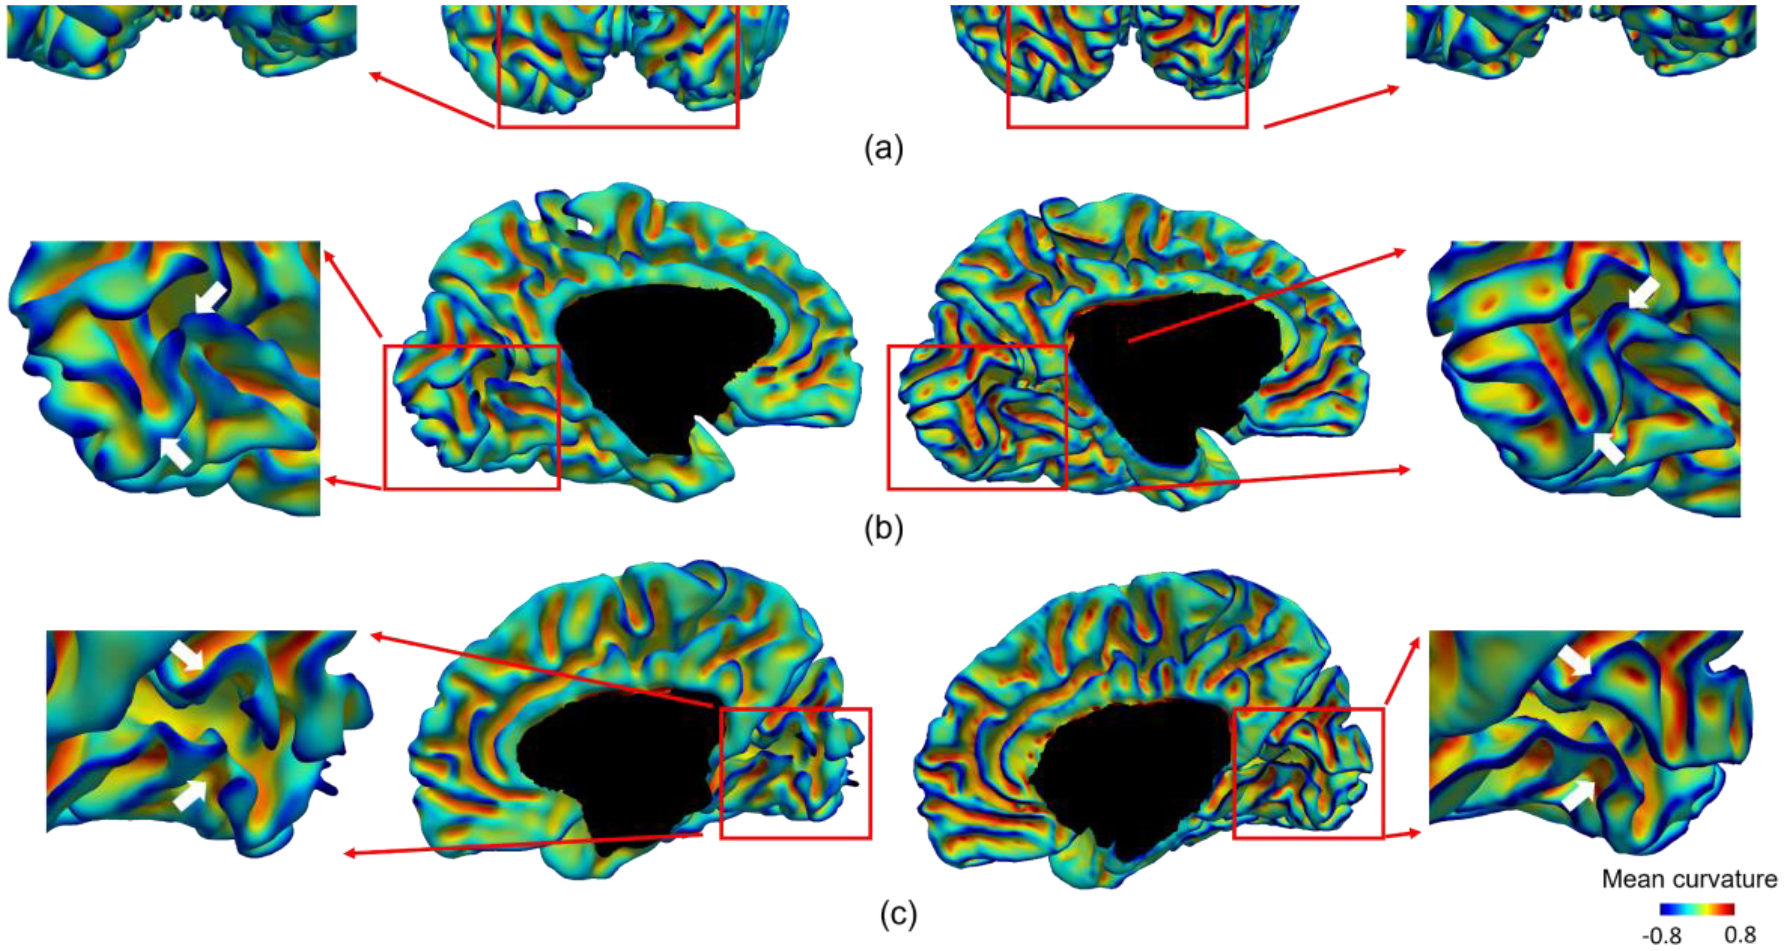
Fig. 9.

Comparison of the reconstructed cortical surfaces in the occipital lobe of a typical subject using the dHCP pipeline and our pipeline. All surfaces are color-coded by mean curvature. (a) The posterior view of both hemispheres. (b) The medial view of the left hemisphere. (c) The medial view of the right hemisphere. For each view, we have magnified the occipital lobe for a detailed comparison.
