
Figure 2. Unadjusted Kaplan-Meier time-to-event curves according to normal or abnormal microvascular resistance.
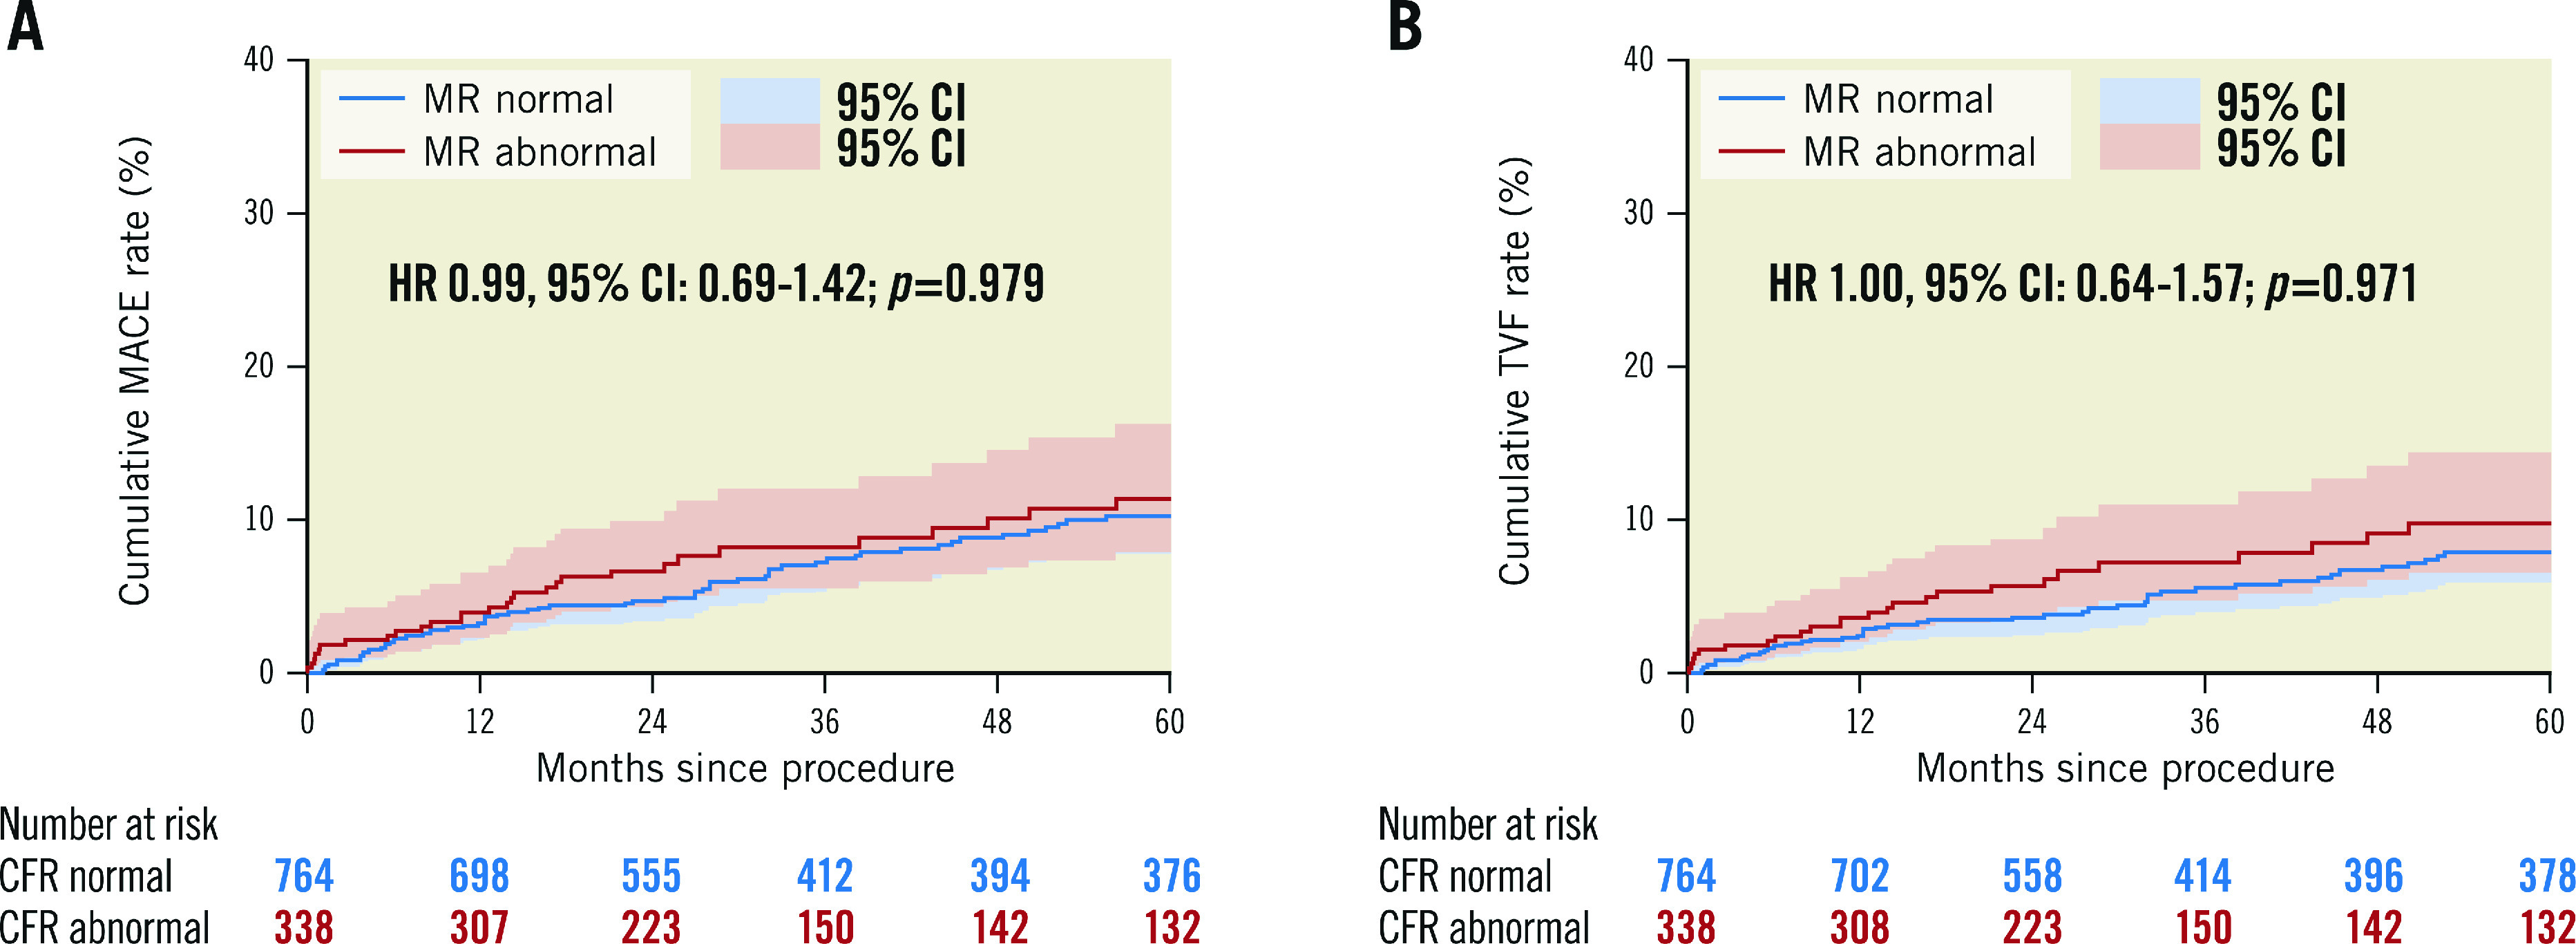
(A) MACE and (B) TVF up to 5-year follow-up. Hazard-ratio (HR) with 95% confidence intervals (CI) presented based on Cox-regression analysis corrected for confounders and adjusted for patient clustering in case of MACE. MACE: major adverse cardiac events; MR: microvascular resistance; TVF: target vessel failure