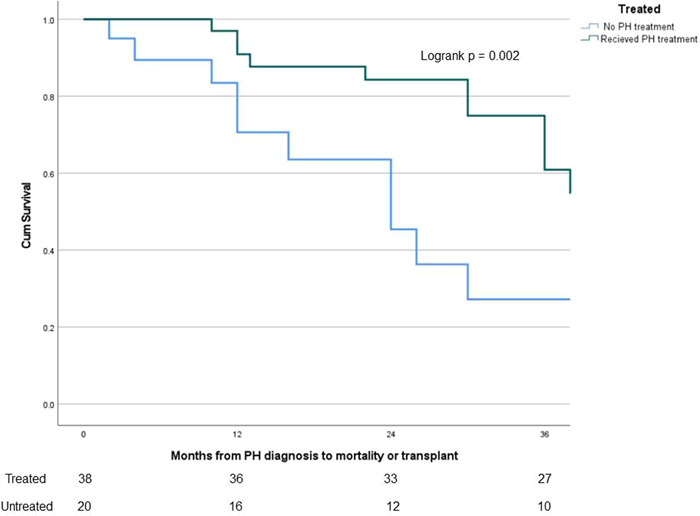
Figure 2.

Survival analysis of treated SAPH versus untreated SAPH since PH diagnosis. Comparison of survival probability between treated SAPH and untreated SAPH patients from time of PH diagnosis. The number of patients at risk in each group displayed on bottom. Changes in the graph due to death before transplant while also censoring those who received lung transplant, as they would no longer be at risk of death before transplant. Lung transplantation is not reflected in the actual Kaplan–Meier curves. A significant difference seen, with lower survival probability demonstrated in the untreated SAPH group (logrank p = 0.002). PH, pulmonary hypertension; SAPH, sarcoidosis‐associated pulmonary hypertension.
