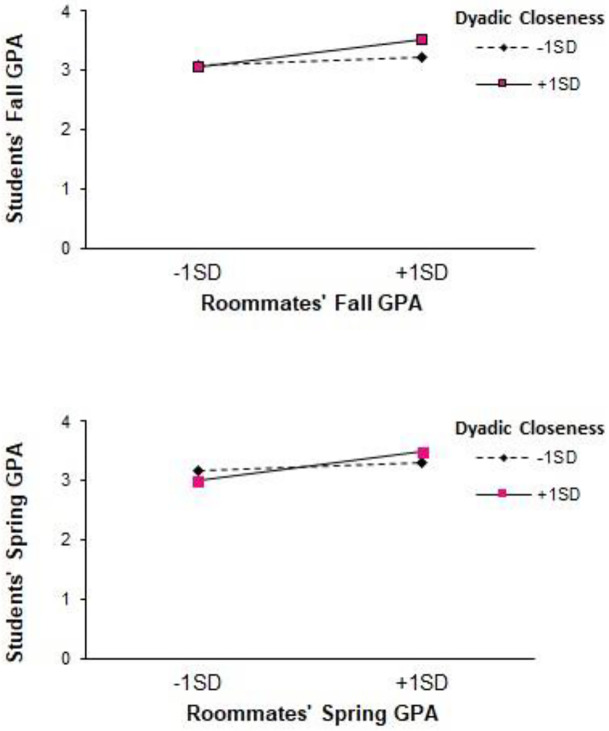
Fig 2. GPA Contagion in the Fall (upper panel) and Spring (lower panel) Moderated by Dyadic Closeness.
Note. These figures depict the simple slopes for GPA contagion at 1 standard deviation above and below the mean of T1 dyadic closeness. The endpoints for these slopes are plotted at 1 standard deviation above and below the means for roommates’ GPAs in fall (upper panel) and spring (lower panel).

