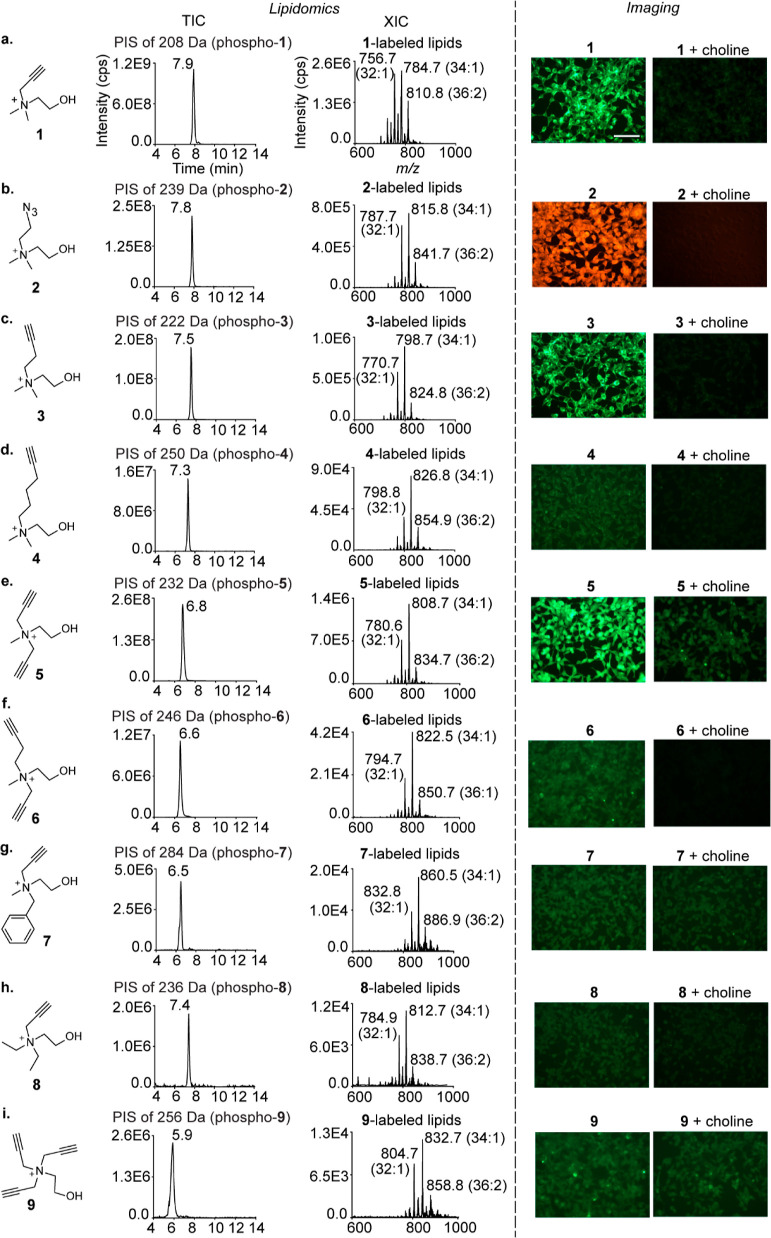
Figure 2.
Characterization of the metabolic labeling of mammalian choline lipids with choline analogues. The lipidomics experiments were performed on the lipids extracted from analogue (2 mM)-administered HEK293 cells and subjecting them to LC–MS/MS in the precursor ion scan (PIS) mode. The TICs are depicted on the left along with the m/z values of the daughter ions and the peak retention time values. The extracted ion chromatograms (XICs) with the three most abundant lipids annotated are depicted on the right. LipidView analyses for annotating all the labeled lipids detected are depicted in Figures S2–S10. The imaging experiments involved treating analogue (2 mM)-administered HEK293 cells (left) with either 5-azido fluorescein (for analogues 1, 3–9) or rhodamine alkyne (for analogue 2) under click chemistry conditions. Competition experiments involved the co-administration of native choline and the analogues (2 mM each; right). The scale bar represents 100 μm.

