Figure 3.
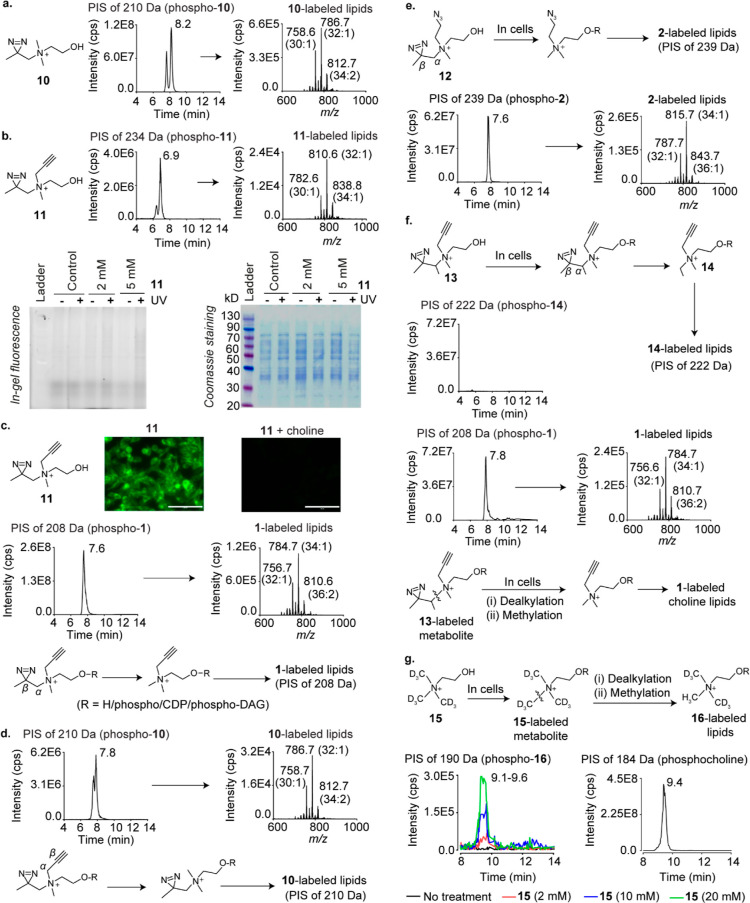
Metabolic labeling studies on β-diazirine choline analogues. (a) PIS lipidomics to detect 10-labeled lipids in 10-administered HEK293 cells. (b) Top panel: PIS lipidomics to detect 11-labeled lipids in 11-administered cells. Bottom panel: in-gel fluorescence experiments on cells metabolically labeled with 11. (c) Top panel: imaging experiments on 11 (2 mM)-administered cells (left), and cells administered with both 11 and choline (2 mM each; right). The scale bars represent 100 μm. Middle panel: PIS lipidomics to detect 1-labeled lipids in 11-administered cells. Bottom panel: the Cα–Cβ bond cleavage hypothesis to explain the formation of 1-labeled lipids in 11-administered cells. DAG is an abbreviation for diacylglycerol. (d) Top panel: PIS lipidomics to detect 10-labeled lipids in 11-administered cells. Bottom panel: the Cα–Cβ bond cleavage hypothesis to explain the formation of 10-labeled lipids in 11-administered cells. (e) Expected formation (top) and detection (bottom) of 2-labeled lipids in 12-administered cells. (f) Expected formation (top) and attempted detection (second panel from the top) of 14-labeled lipids in 13-administered cells. Third panel from the top: the detection of 1-labeled lipids in 13-administered cells. Bottom panel: a hypothesis invoking N–C bond cleavage followed by methylation to explain the formation of 1-labeled choline lipids in 13-administered cells. (g) Expected generation (top) and detection (bottom left panel) of D6-labeled (16-labeled) choline lipids due to N–C bond cleavage followed by methylation in D9 choline (15)-administered cells. Bottom right panel: the detection of native choline lipids in cells cultured in standard media devoid of non-natural choline analogues. The LipidView analyses of all XICs are provided in the Supporting Information section. All analogues were administered at 2 mM concentrations unless otherwise stated.

