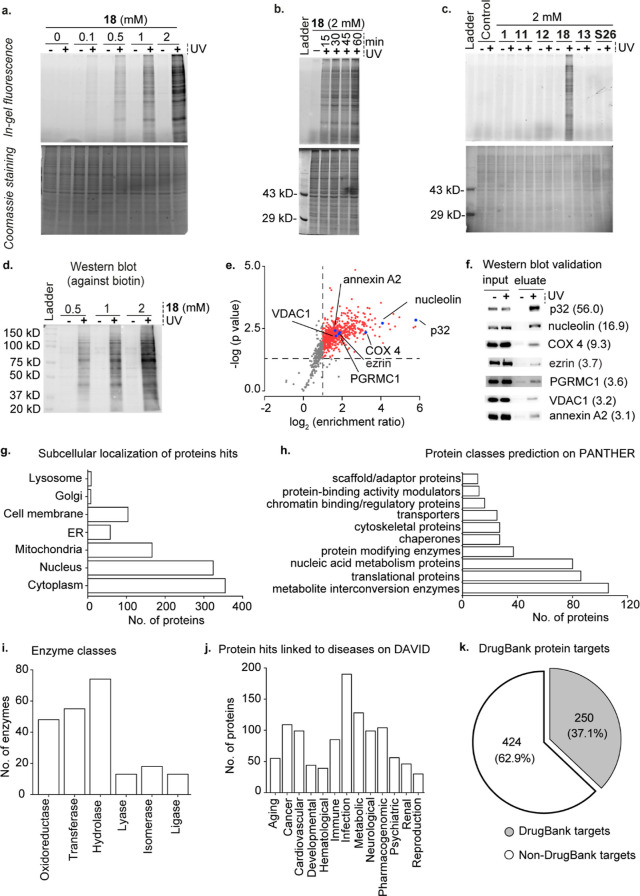
Figure 5.
Identification of the choline metabolite and lipid-interacting proteome of HEK293 cells by using the γ-diazirine choline analogue 18. Panels (a–c) depict in-gel fluorescence data. (a) Photocrosslinking experiments on HEK293 cells metabolically labeled with different concentrations of 18. (b) UV exposure time-dependence on the photocrosslinking efficiency in cells metabolically labeled with 18. (c) Comparison of photocrosslinking efficiency in cells metabolically labeled with 11, 12, 13, 18, and S26. Propargyl choline (1) was used as a negative control. (d) Western blot characterization of the dose-dependence of avidin-enrichment of biotinylated UV-crosslinked proteins obtained from cells metabolically labeled with 18. (e) Plot depicting the results of our six-plex TMT analysis (three +UV and three −UV samples). The averaged enrichment ratio for each of the 902 proteins detected is plotted against their respective p-values, and the 674 high-confidence protein hits (enrichment ratio ≥ 2.00 and p-value of ≤ 0.05) taken forward for further analysis are depicted as either red or blue dots. (f) Western blot validation of the enrichment of the seven proteins marked by blue dots in Figure 5e blotted by using primary antibodies against the individual proteins with their TMT enrichment ratios depicted within parentheses. (g) Subcellular distribution of our protein hits as per the UniProt database. (h) Protein hits classified according to their biochemical functions as per the PANTHER database. (i) Classification of the enzyme protein hits according to the UniProt database. (j) Protein hits genetically linked to various disease classes as per the DAVID database. (k) Pie-chart depicting the classification of the protein hits with respect to their annotation as drug targets according to the DrugBank database. The lists of all the proteins in the above analyses are provided in Table S3.

