
FIGURE 2.
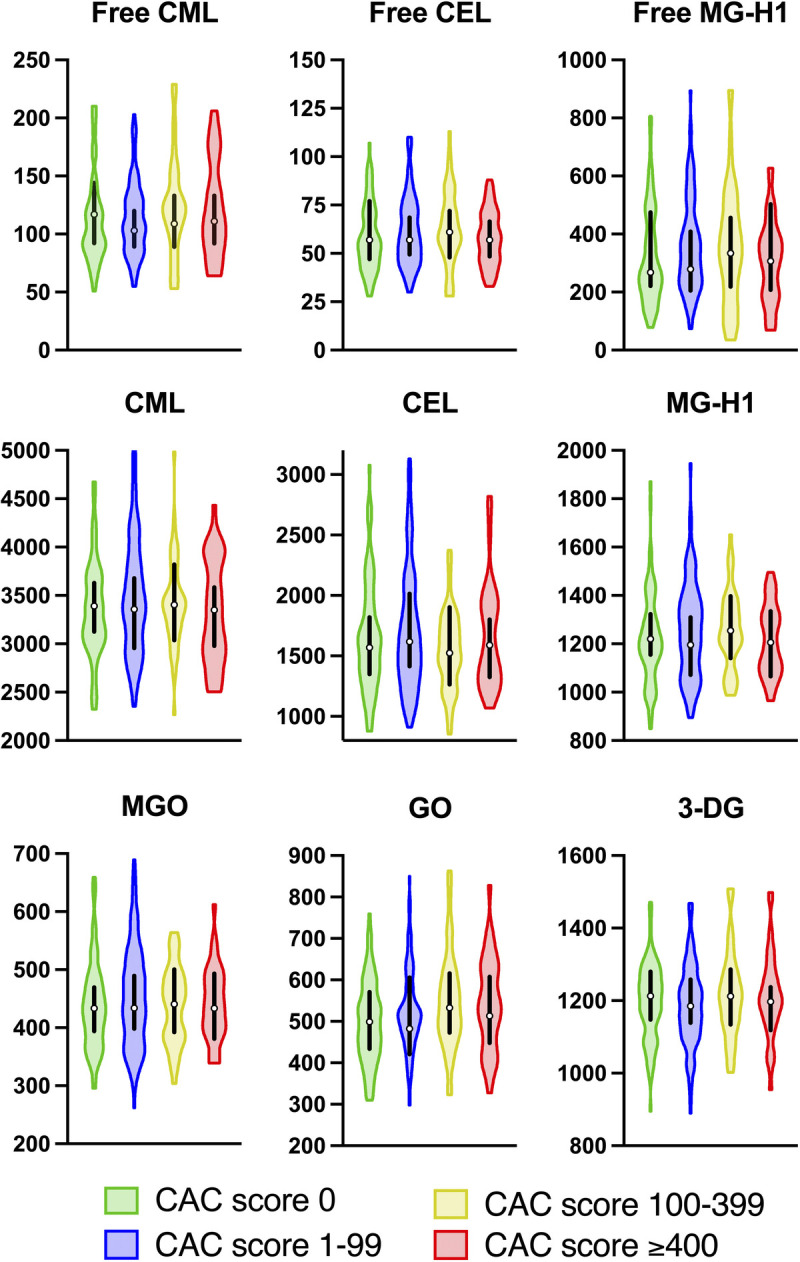
Concentrations of AGE and dicarbonyl compounds stratified by CAC score groups. Distribution of concentrations demonstrated by violin plots with median concentrations (quartiles 1–3) marked with black lines. We found no differences in biomarker concentrations after stratifying participants by CAC score groups. CML, Nε-(carboxymethyl)-lysine; CEL, Nε-(1-carboxyethyl)-lysine; MG-H1, Nδ-(5-hydro-5-methyl-4-imidazolon-2-yl)-ornithine; MGO, methylglyoxal; GO, glyoxal; 3-DG, 3-deoxyglucosone (3-DG).