Figure 2. Innovations clarify the effect of movement and pupil size on cortical state fluctuations.
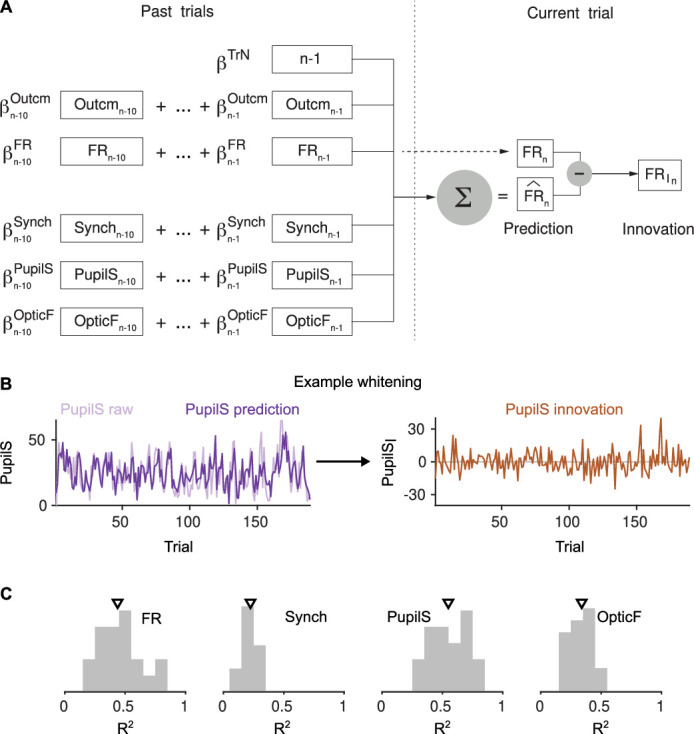
(A) Linear mixed model regression (Methods) of firing rate (FR; top) and Synch (bottom) on movement and pupil size. Graphs show values of regression coefficients. Box plots here and elsewhere represent median, interquartile range and 95% confidence interval (CI) on the bootstrap distribution of the corresponding parameter (Methods). Offset can be read from the right y-axis. (B) Example of the process of calculating innovations for the baseline FR of one recording session. Top, raw data and prediction of the raw data (Figure 2—figure supplement 2; Methods). The innovation FRI (bottom) is the difference (prediction residual) between the two traces in the top. (C) Correlation between OpticF, PupilS, FR, and Synch innovations. Diagonal and above, cross-correlations between each of the four signals (black, median across recordings; gray, median absolute deviation [MAD]). Below diagonal. For each pair of innovations, histogram across recordings of their instantaneous correlation. Triangles mark the median across recordings. (D) Identical analysis as panel (A) but using innovations instead of the raw signals.

Figure 2—figure supplement 1. Slow trends of baseline signals during the session.
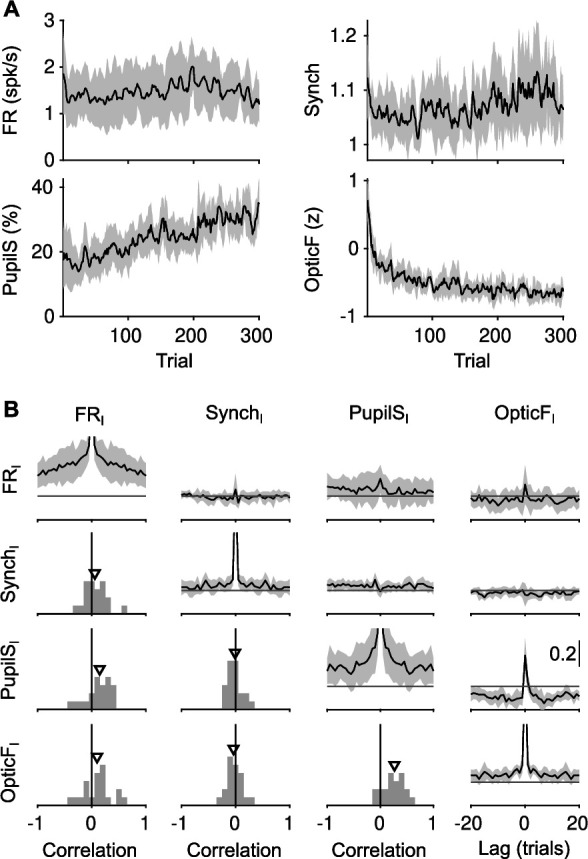
Figure 2—figure supplement 2. Constructing innovations by cross-whitening.