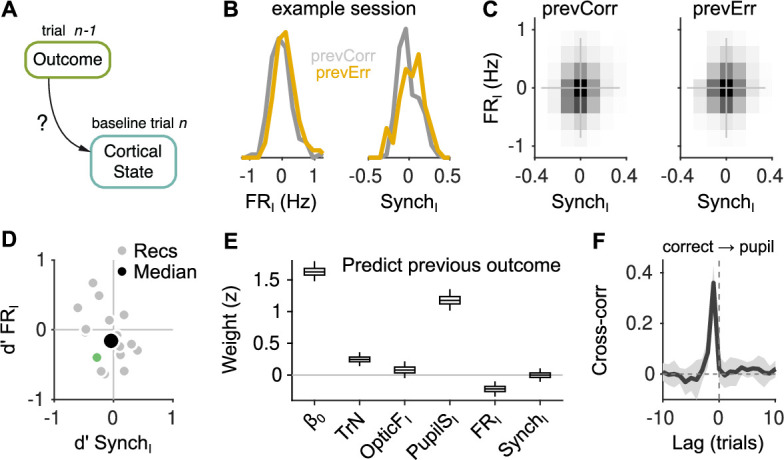
Figure 4. Effect of outcome on baseline activity.

(A) Schematic illustration of the question addressed in this figure. (B) Distribution of FRI (left) and SynchI (right) after each of the two outcomes for an example session. (C) Joint histogram of FRI and SynchI on aggregate across recordings after a correct (left) and after an error (right) trial. (D) Discriminability index between the distributions of FRI and SynchI (such as those in (B)) after each of the two outcomes. Each gray dot corresponds to one recording, the colored dot is the example recording in (B), and the large black circle is the median. (E) Coefficients of a generalized linear mixed model (GLMM) fit to the outcome (correct or error) of the mice’s choices on trial using as regressors TrN and innovations from the baseline of trial . (F) Cross-correlation function between the raw outcome and PupilS time series (Methods). Black is the median across recordings, gray is the median absolute deviation (MAD). Throughout this figure, innovations were modified so as to exclude previous outcomes in the calculations of the residuals (Methods).
