. 2023 May 17;12:e81774. doi: 10.7554/eLife.81774

Figure 5. Effect of cortical state fluctuations on premature responding and engagement.

(A) Definition of premature responses and skips. (B) Aggregate across sessions of the distribution of reaction times (RTs) in our task. Dashed lines indicate the response window in which a correct response was rewarded (valid trials). Trials where a response is not produced before the dotted line are defined as skips. Top, colors used to signal each trial type in (B). (C) Accuracy (median ± median absolute deviation [MAD] across recordings) conditional on RT. (D) Coefficients of a generalized linear mixed model (GLMM) fit to explain whether a given trial is premature or valid. Magnitude of the offset (β0) should be read of from the right y-axis. (E) Probability of not responding to the stimulus (skip) in an example session. Skips tend to occur in bouts and are more frequent toward the end of the session. (F) Same as (D) but for a GLMM aimed at explaining if a particular trial is a skip or valid.
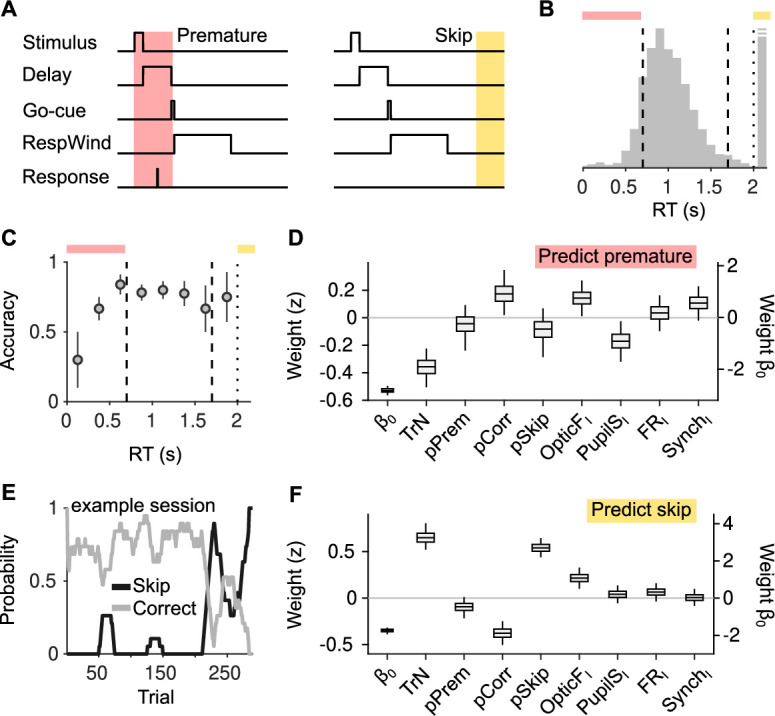
Figure 5.

Figure 5—figure supplement 1. Explaining reaction time (RT) in valid trials.

Figure 5—figure supplement 1.

(A) Histogram of RTs (equivalent to Figure 5A). For this figure, we attempt to explain RTs within the two dashed lines (gray bar), that is, during valid trials. (B) Coefficients of a LMM explaining RT using the same predictors as in our other analyses on responsivity in Figure 5D, F. Coefficients for session trend and previous outcome are positive and negative, respectively (p<0.0002 and p=0.0006, bootstrap), showing that mice tend to slow down through the session – consistent with them progressively losing motivation – and also after an error – revealing that post-error slowing down is evident despite the delay period in the task. Although the pSkip coefficient is not significant (p=0.075, bootstrap), mice tend to be slower in responding after a disengaged trial, suggesting a continuity between long RTs and lack of response. This is consistent with the positive association between facial movement in the baseline (OpticFI) and RT (p=0.01, bootstrap), which is also present in the prediction of skips (Figure 5F). Neither pupil size, firing rate, or synchrony innovations explain RT (p=0.78, p=0.42, and p=0.45 for PupilSI, FRI, and SynchI, respectively, bootstrap). (C) Same as (B) but without cross-whitening the predictors.