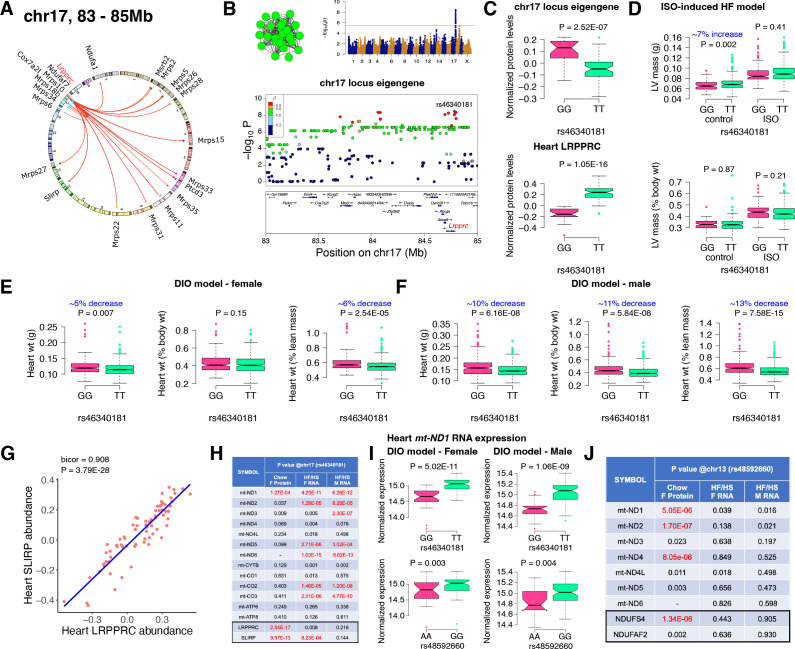
Figure 3. Chr17 locus controls mitoribosomes via LRPPRC/SLIRP.
(A) Circos plot showing chr17 hotspot. Each line signifies a significant association between the genetic variants and the respective protein levels with candidate genes being highlighted. (B) Manhattan and regional plots of chr17 locus (green module) eigengene, respectively. Red line signifies genome-wide significance threshold (P<4.1E-06). The peak SNPs and the candidate genes are highlighted. Genotype distribution plots of (C) protein levels and eigengenes, and cardiac phenotypes from (D) ISO-induced HF model and (E) female and (F) male DIO model at peak SNP (rs46340181) associated with chr17 locus. (G) Protein-by-protein correlation plot between heart LRPPRC and SLIRP abundance levels. (H) Association p values between mtDNA-encoded mRNA expression or protein abundance levels and peak SNP (rs46340181) associated with chr17 locus in both sexes of HMDP. (I) Genotype distribution plots of heart mt-ND1 mRNA expression from female and male DIO model at peak SNPs associated with chr17 (rs46340181) or chr13 (rs48592660) loci, respectively. (J) Association p values between mtDNA-encoded complex-I related mRNA expression or protein abundance levels and peak SNP (rs48592660) associated with chr13 locus in both sexes of HMDP. Data are presented as (C–F and I) boxplots showing median and interquartile range with outliers shown as circles (n=68–72 strains for protein levels; n=92–95 strains for ISO-model; n=92–100 strains for DIO-model). p Values were calculated using (A, B, H and J) FaST-LMM that uses Likelihood-Ratio test; (C–F and I) Unpaired two-tailed Student’s t test; (G) BicorAndPvalue function of the WGCNA R-package that uses Unpaired two-tailed Student’s t test.

