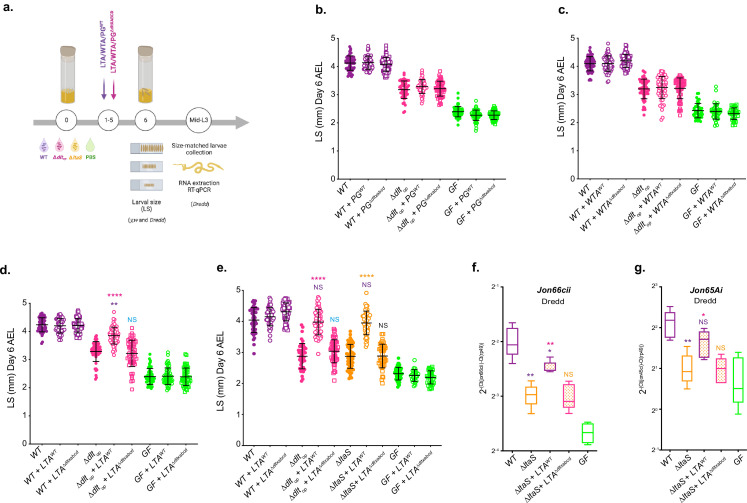
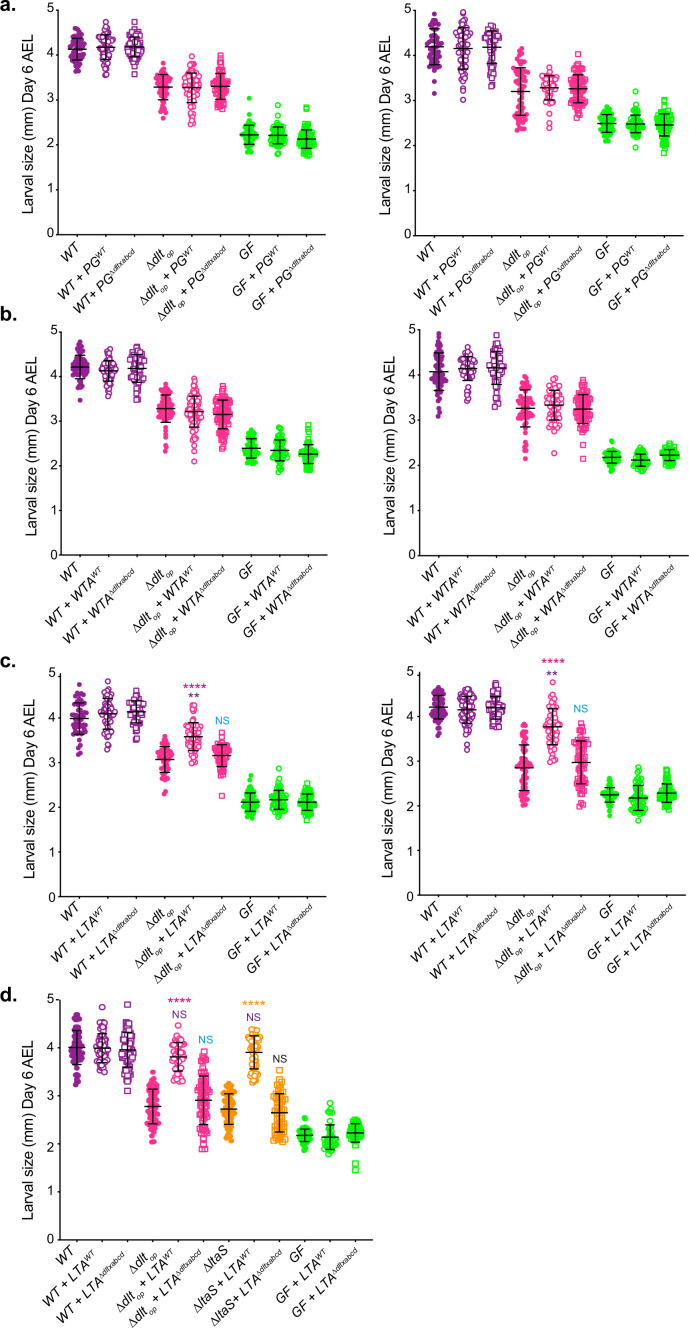
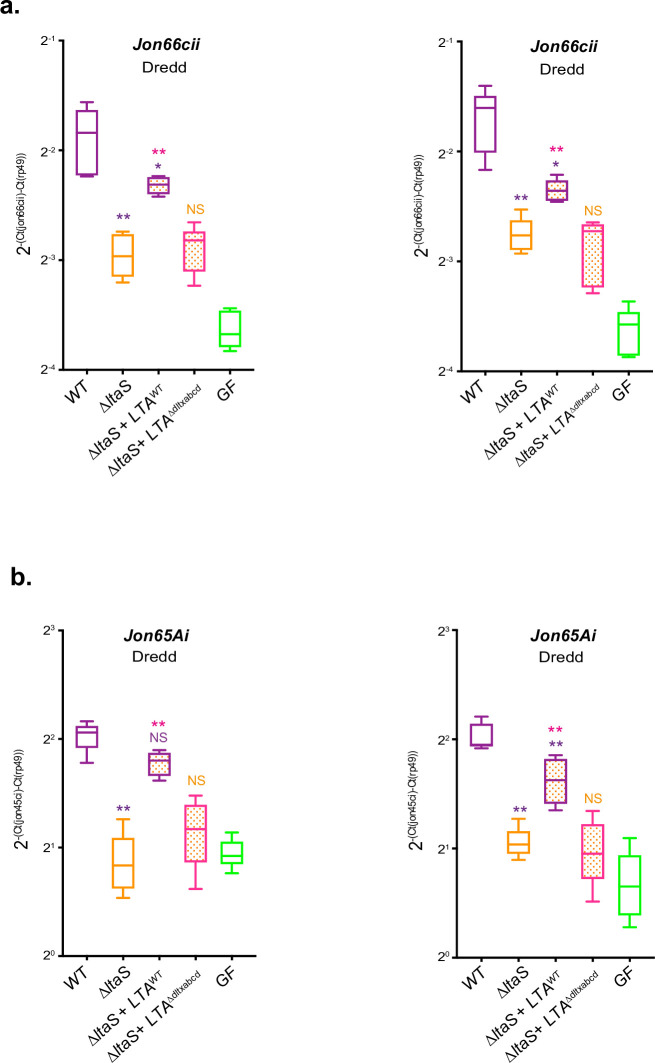
Figure 6. D-Ala lipoteichoic acids (LTAs) are bacterial cues supporting Drosophila intestinal response and juvenile growth.
(a) Experimental set-up to test the impact of cell envelope components on Drosophila growth and proteases expression: germ-free (GF) eggs were inoculated with WT, ∆dltop, ∆ltaS, or PBS for the GF condition and supplemented daily (for 5 d) with LTA, wall teichoic acid (WTA), and peptidoglycan (PG) extracted from WT or ∆dltXABCD strains. 1 µg of each component purified from WT was used. For comparison with components extracted ΔdltXABCD strain, the final PG, WTA, and LTA suspensions were adjusted to the same amount of Gro, Rbo, and Mur, respectively. At day 6 after inoculation, larvae were harvested and measured (see the ‘Materials and methods’ section for details). Mid-L3 sized-matched larvae were collected for each condition. Their guts were dissected followed by RNA extraction and RT-qPCR targeting proteases expression. (b–d) Larval longitudinal length after inoculation with strains WT, ∆dltop, PBS, and purified PG (PG) (b) WTA (c) or LTA (d) from WT or ∆dltXABCD. Larvae were collected 6 d after the first association and measured as described in the ‘Materials and methods’ section. The pink asterisks represent a statistically significant difference compared with ∆dltop larval size; purple asterisks represent a statistically significant difference compared with WT larval size. NS represents the absence of a statistically significant difference compared to ∆dltop. ****p<0.0001; **0.001<p<0.01. The bars in the graph represent means and SD. A representative graph from one out of three independent experiments is shown. (e) Larval longitudinal length after inoculation with strains WT, ∆dltop, ∆ltaS, or PBS and purified LTA from WT or ∆dltXABCD strains. Larvae were collected 6 d after the first association and measured as described in the ‘Materials and methods’ section. The pink asterisks represent a statistically significant difference compared with ∆dltop larval size; purple asterisks represent a statistically significant difference compared with WT larval size ****p<0.0001; **0.001<p<0.01. The bars in the graph represent means and SD. A representative graph from one out of three independent experiments is shown. (f, g), Mean ± SD of 2-∆Ctgene/∆Ctrp49 ratios for Jon66Cii and Jon65Ai detected in dissected guts of y,w,Dredd size-matched larvae, associated with LpNC8, ∆dltop, ∆ltaS or the GF and LTA from WT or ∆dltXABCD strains, from five biological replicates. Representative graphs from one out of three independent experiments are shown. The purple asterisks represent a statistically significant difference compared with LpNC8 protease expression. The pink asterisks represent a statistically significant difference compared with ∆ltaS supplemented with LTA from ∆dltXABCD strain. NS represents the absence of a statistically significant difference compared to ∆ltaS condition. **0.001<p<0.01; *p<0.05.


