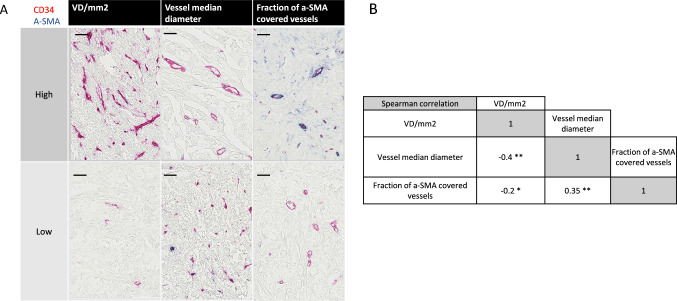
Fig. 1.
A Intertumoral heterogeneity in vessel median size, vessel density, and fraction of a-SMA covered vessels in the “whole section” cohort. Double staining with CD34 and a-SMA showing examples of high and low cases regarding vessel size, vessel density, and fraction of a-SMA covered vessels between different cases in the “whole section” cohort. Variables were dichotomized as “low (0–50%)” group and “high (> 50%)” group, based on the median value. Size bars correspond to 100 μm. B Intertissue metric correlations. Spearman correlation coefficients representing associations between vessel median size, vessel density, and fraction of a-SMA covered vessels in the “whole section” cohort. *p < 0.05, **p < 0.001

